View a process map
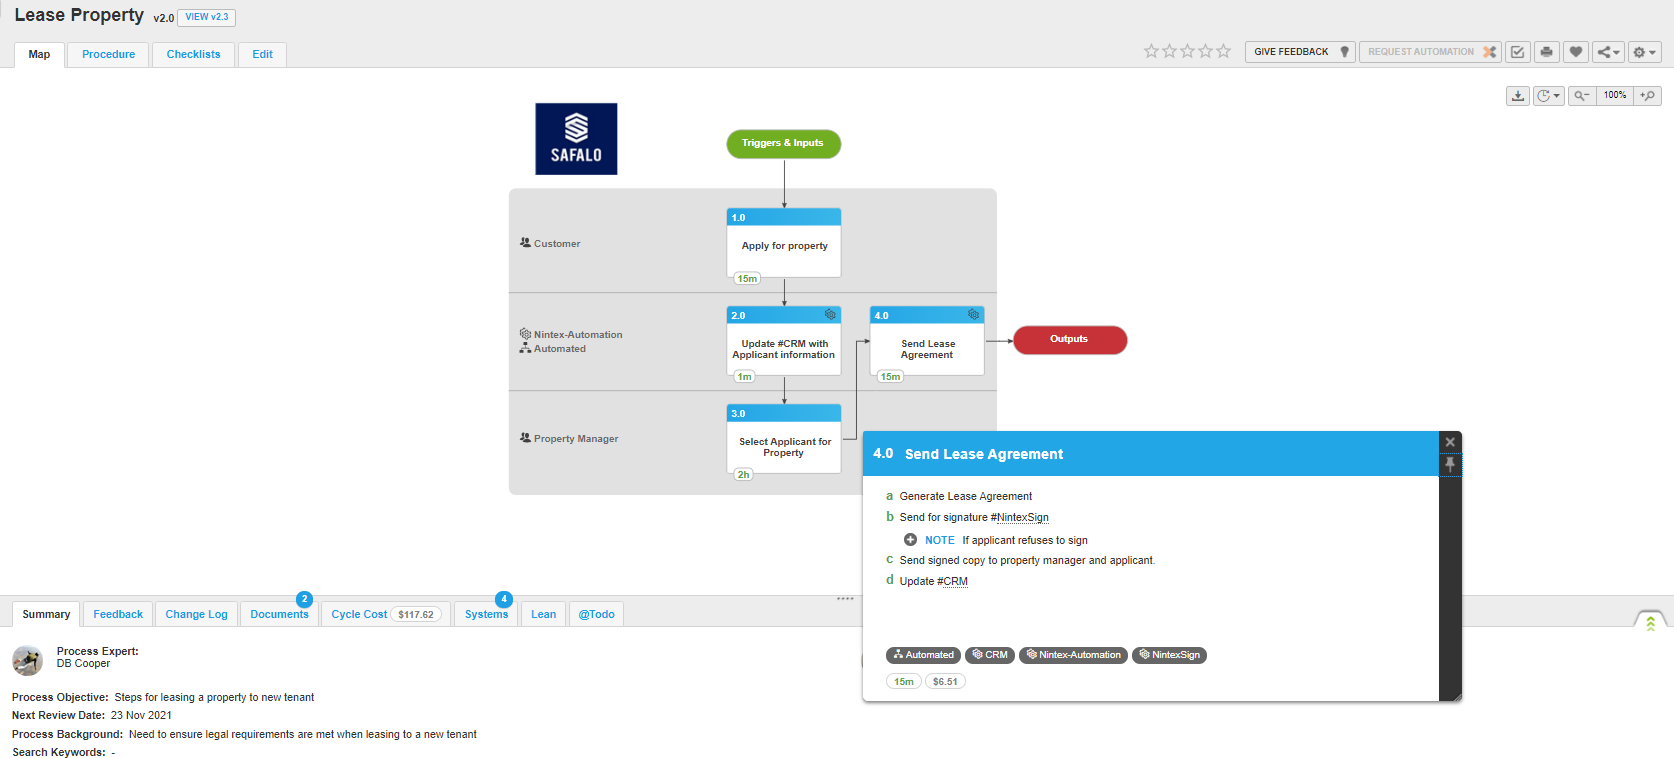
After you create or edit the process, use the Map tab to view the complete process at a glance. The swim lane icons in the process map help you identify which activities are conducted by roles within your organization, and which are automatically carried out within your business systems.
The details displayed on the Map page are shown in the image below:
View process map details
| Action | Details |
|---|---|
| View activity details |
Activities are clear and well-defined on the process map, distinguishing each of the key steps. You can clearly see parallel activities, decision blocks and the next set of steps.
|
| Open links |
|
| Copy process |
A copy of the process prefixed with "Copy of" is created and displays. You can click Edit and make the required changes. For more information, see Edit a process. No. You can copy the individual activity text or export procedure text. |
| Download process map |
Click |
| Change process map display size |
|
| Display/hide timeframe and tags |
The process map view can also summarize costs and timeframes, or identify related process or systems tag opportunities, or even automation based on configuration settings.
When switched on, the tags show the relevant information on both the process map overview and the activity pop-ups. This allows you to understand the cost of each step, or instantly identify steps that offer opportunities for improvement. Using automation tagging will highlight where activities can be assigned to bots or systems to further streamline your process, while the timeframe tags will show exactly where time is spent. |
.png) on the top right of the process toolbar and then click Copy Process.
on the top right of the process toolbar and then click Copy Process. to download the process map in .svg (Scalable Vector Graphics) format. You can imported to
 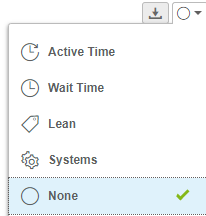 and select a timeframe or process/system tag you want to display on the activity block in the process map.
Process attributes
The following options are displayed in the Process attributes drop-down:
| Option | Details |
|---|---|
| Summary |
Displays the following details:
|
| Change Log |
Displays changes made to the process in the following columns:
|
| Documents | Displays the Type and Name of the documents attached to the process. |
| Cycle costs |
Displays the process cost and timeframe details in the following columns and rows:
|
| Systems | Displays the system(s) tagged in the process. |
| Lean Tag | Displays the lean tags in the process. |
| Todo |
Displays the list of @Todo details added in the process in the following columns:
|