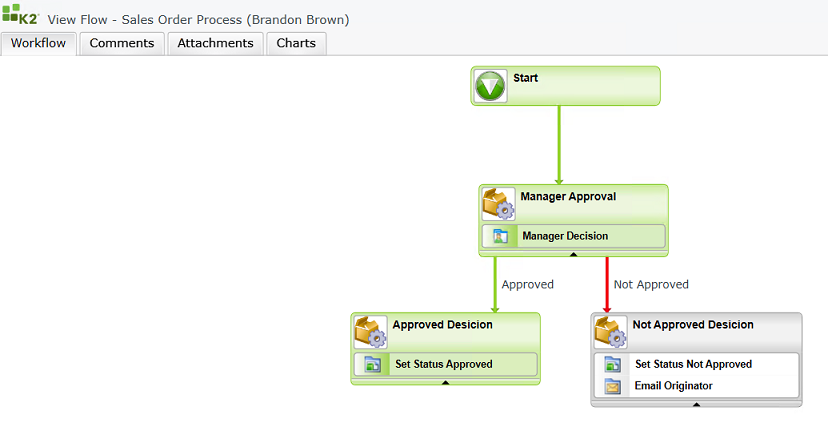
View Flow
The View Flow is a useful tool to investigate the path followed by a particular workflow instance and to gain more insight into events that occurred during the process instance.
- It provides a detailed view of the actions taken during the workflow.
- If the workflow is still active, the View Flow will also update in real time to reflect the current status of the workflow instance.
- The View Flow Report uses color-coding to identify which steps and lines in the workflow were executed.
- It is a live, almost real-time reflection of a workflow's path.
- Make use of Filters and Settings to display required data in the report.
Example of where to use this report:
- As a visual representation of a specific workflow.
- To see the history of a specific workflow.
- To drill-down into steps and view who acted on a task, when it was performed and what the action was.
- To determine where a workflow is currently at and which users need to action a task within the workflow.
- To view process-level data values.
- To view graphical reports such as how long a workflow has spent in each step.
- To view comments and attachments added to the workflow through the standard comments / attachments functionality in K2.
The Standard Reports have a level of security to ensure that the data is seen by authorized individuals within a corporation. Permissions are based on the workflow rights assigned to the workflow in Management Console:
- Users with Admin or View permissions will be able to see all instances of that workflow in the Standard Reports.
- Users with View Participate permissions will be permitted to view the workflow instances of that workflow, in the Standard Report but only from where the user actually participated in that workflow.

Permissions need to be assigned for each separate workflow by the System Administrator. Permissions can be assigned to a group and user within the groups will be able to view the Standard Reports.
- Access the View Flow from:
- The Process Overview Report
- The K2 Worklist
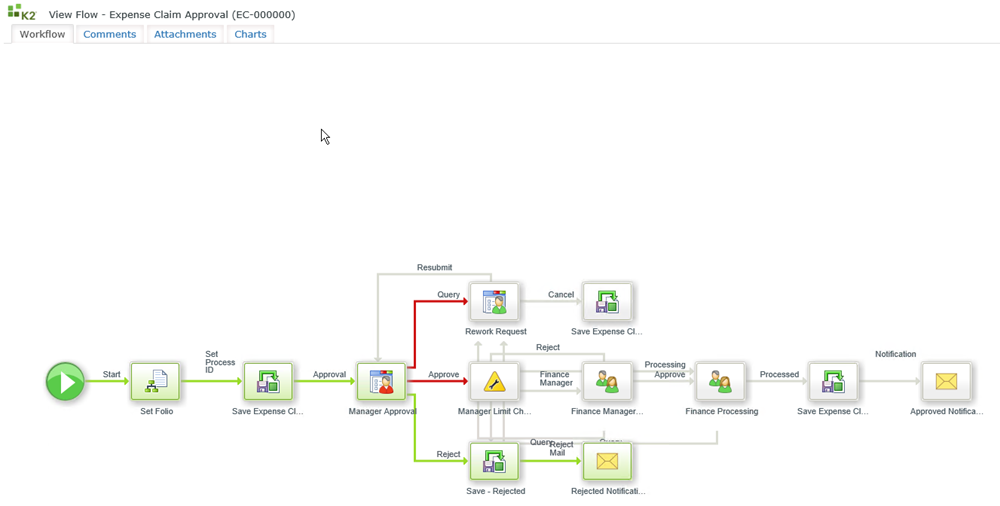
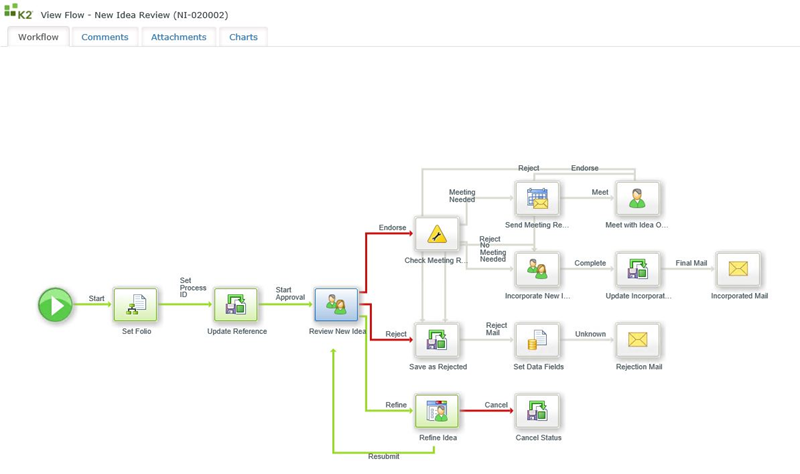
- Line Rules that evaluated to true, and were successful are colored green.
- Line Rules that evaluated to false, and were not successful are colored red.
- Skipped lines or net yet evaluated lines remain clear.
- Items represented in green indicates that the step has been completed.
- Items represented in blue are currently active.
- Items represented in gray have not been executed, or are currently not yet executed.
- On the View Flow there are four tabs containing detailed information on the selected workflow. They are:
- Green - The item completed within the expected duration OR expected duration had not exceeded yet and will not exceed within the next 24 hours.
- Yellow - The item is not yet completed and the current running duration, plus 24 hours, exceeds expected duration.
- Red - The running duration exceeds the expected duration.
- The Refresh interval can be changed in the web.config file, which can be found in the following location - Program Files\K2 blackpearl\WebServices\ViewFlow. To change the value in the ViewFlowRefreshTime key node edit the value="30" number.
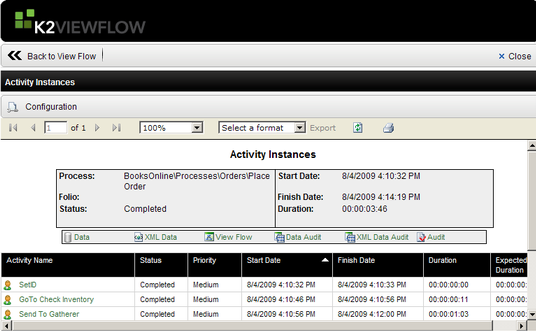
- The Classic View Flow can still be accessed as per usual. With the Classic View Flow, reports can be accessed about a specific activity by clicking on the activity in the View Flow window. Certain reports can be assessed via the View Flow in the following manner:
- The Activity Instances report will open when clicking on the Process Properties button, or alternatively when double clicking on the white canvas.
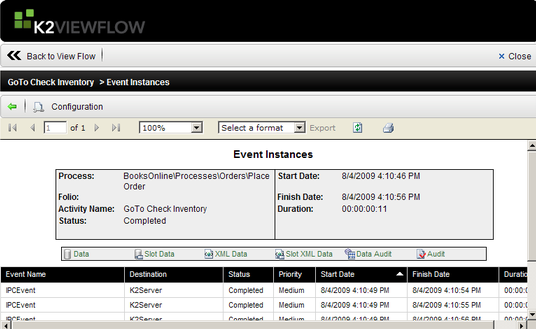
- The Event Instances Report will open when clicking on the activity within the View Flow window.
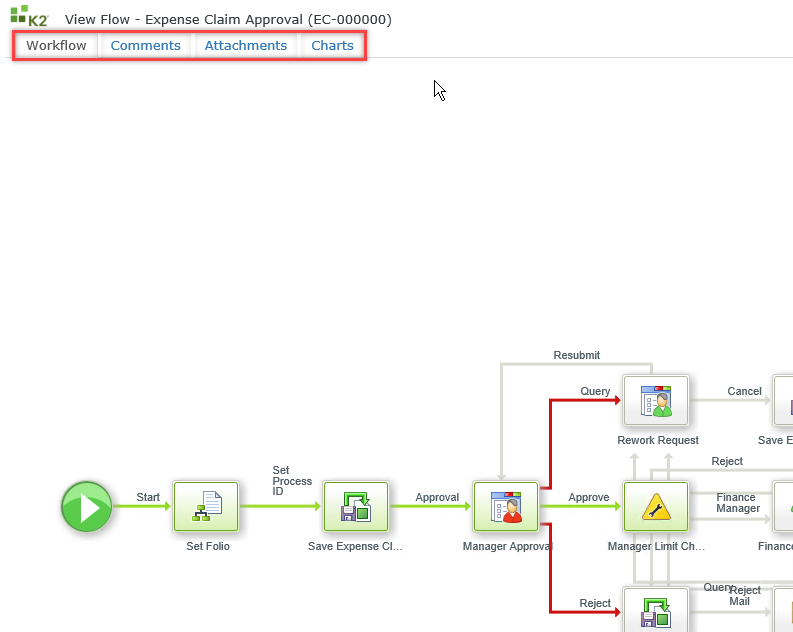
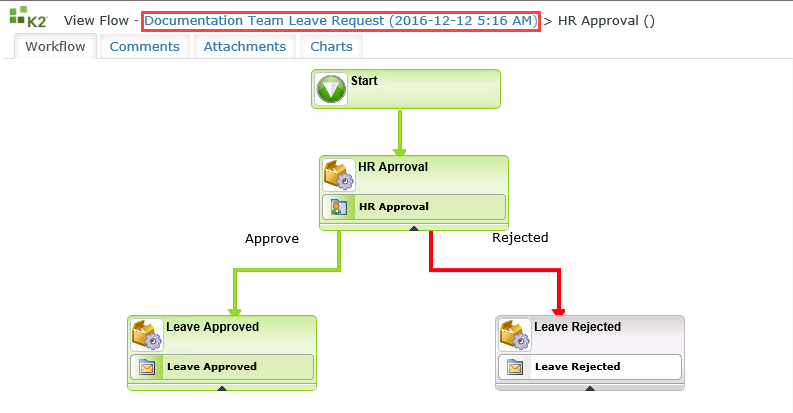
Below describes how to interpret a View Flow diagram:
The Worklfow tab of the View Flow represents the steps of the process and which route has been taken.
Process Summary
When clicking on the Start activity, the Process Summary dialog opens which contains the Overview and Process Data tabs.
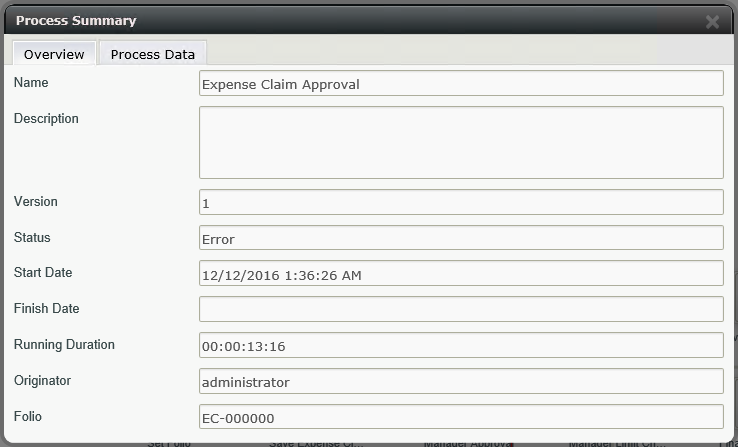
The Overview tab contains details of the Process. The table below explains the available fields:
| Feature | Description | Sample Value |
|---|---|---|
| Name | Displays the name of the process as configured in the workflow designer. | View only. |
| Description | Displays the description as configured in the workflow designer. | View only. |
| Version | Displays the version of the process for which a process instance was started. | View only. |
| Status | Displays the status of the process instance i.e. complete, active or error. | View only. |
| Start Date | Displays the date that the process instance was started. | View only. |
| Finish Date | Displays the date that the process instance was finished. | View only. |
| Running Duration |
Displays the actual duration of the process instance from the start until the present, or until completed. The dot icon next to the Running Duration represents whether it was completed within the expected duration or not. |
View only. |
| Expected Duration | Displays the expected duration of the process instance configured in the workflow designer | View only. |
| Originator | Displays the person from where the process instance originated from i.e. the person who started the process instance. | View only. |
| Folio | Displays the Folio used when the process instance was started. | View only. |
The Process Data tab contains the details of the Process Data fields.
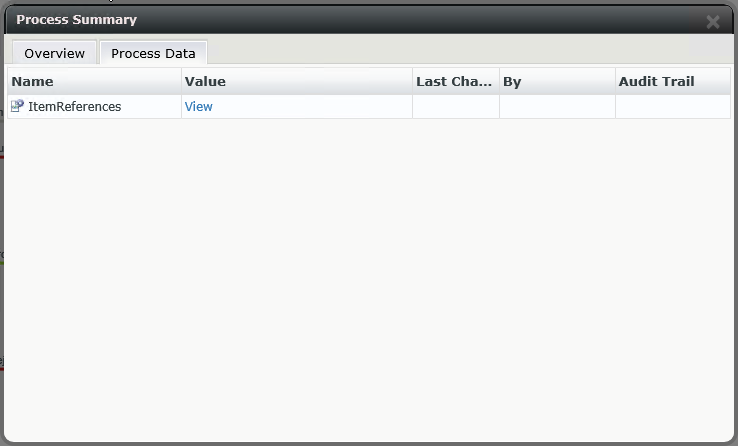
The columns can be resized by dragging the column lines as required.
The table below explains the available fields:
| Feature | Description | Sample Value |
|---|---|---|
| Name | Displays the name of the data field. | View only. |
| Value | Displays the value of the data field. | View only. |
| Last Change | This field populates with the date it was changed, if the current value is different from the initial (default) value. | View only. |
| By | This field populates with the person who last changed the data field, if the current value is different from the initial (default) value. |
If the value of a Data field or XML field has changed in the process, an Audit Trail link will display. Click on the link to view the changes.
Activity Summary
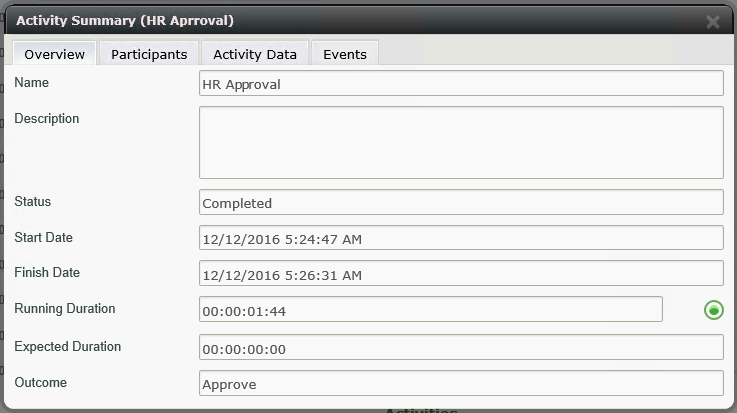
When clicking on an Activity, the Activity Summary dialog opens which contains the Overview, Participants, Activity Data and Events tabs.
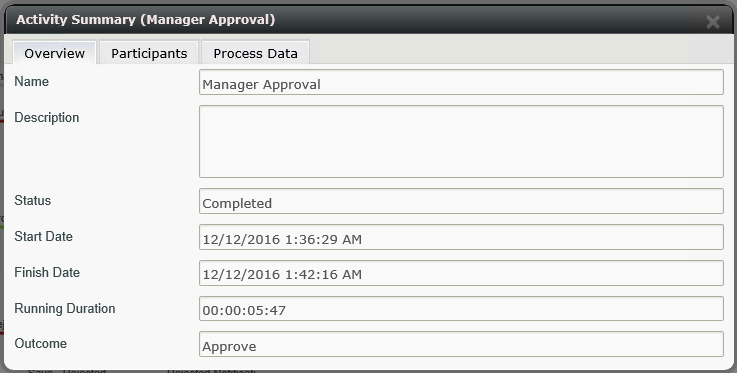
The Overview tab contains the details for the specific Activity. The table below explains the available features:
| Feature | Description | Sample Value |
|---|---|---|
| Name | Displays the Name of the activity as configured in the workflow designer. | View only. |
| Description | Displays the description as configured in the workflow designer. | View only. |
| Status | Displays the status of the activity instance i.e. complete, active or error. | View only. |
| Start Date | Displays the date that an activity instance of the workflow was started. | View only. |
| Finish Date | Displays the date that an activity instance of the workflow was finished. | View only. |
| Running Duration |
Displays the actual duration of the activity from the start until the present, or until completed. The dot icon next to the Running Duration represents whether it was completed within the expected duration or not. |
View only. |
| Expected Duration | Displays the expected duration of the activity instance configured in the workflow designer | View only. |
| Outcome | Displays the outcome as configured in the client event wizard of the workflow designer. | View only. |
The Participants tab contains the details of the participants of the activity.
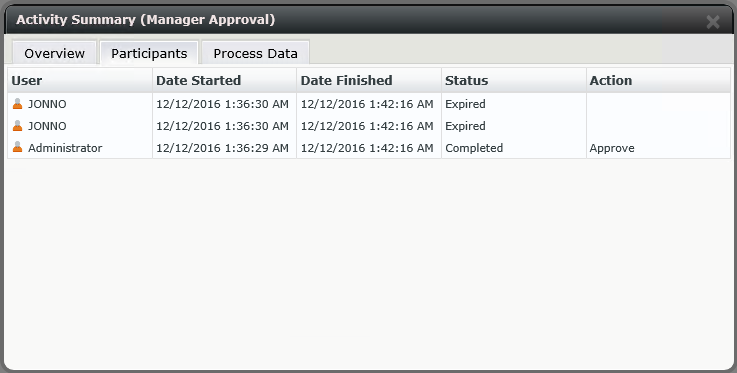
The columns can be resized by dragging the column lines as required.
The table below explains the available fields:
| Feature | Description | Sample Value |
|---|---|---|
| User | Displays the user who participated in the activity instance of the workflow. | View only. |
| Date Started | Displays the date the activity instance of the workflow was started. | View only. |
| Date Finished | Displays the date the activity instance of the workflow was finished. | View only. |
| Status | Displays the status of the activity instance i.e. completed, active or error. | View only. |
| Action | Displays the action performed by the participant. The available actions are related to the outcomes as configured by the workflow designer. | View only. |
The Process Data tab contains the details of the Events of the Activity.
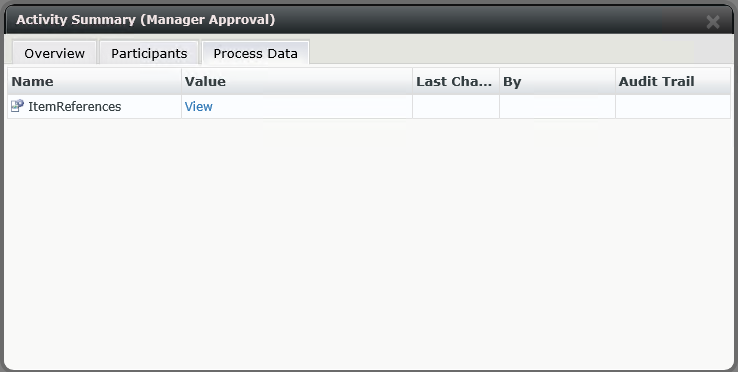
The columns can be resized by dragging the column lines as required.
The table below explains the available fields:
| Feature | Description | Sample Value |
|---|---|---|
| Name | Displays the name of the data field. | View only. |
| Value | Displays the value of the data field. | View only. |
| Last Change | This field populates with the date it was changed, if the current value is different from the initial (default) value. | View only. |
| By | This field populates with the person who last changed the data field, if the current value is different from the initial (default) value. | View only. |
The Events tab contains the details of the Events of the Activity.
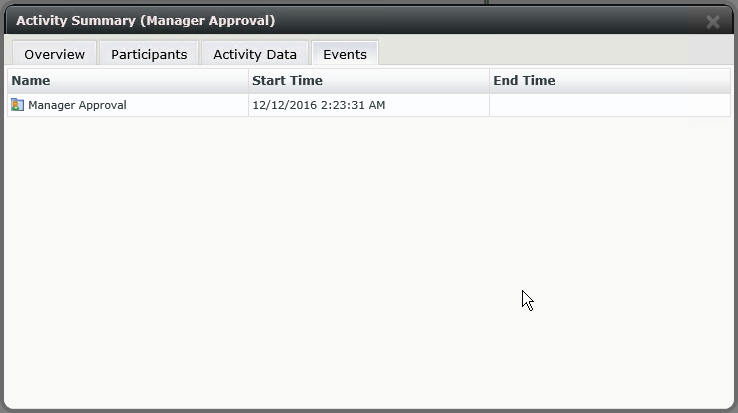
The columns can be resized by dragging the column lines as required.
The table below explains the available fields:
| Feature | Description | Sample Value |
|---|---|---|
| Name | Displays the name of the event. | View only. |
| Start Time | Displays the start of the event. | View only. |
| End Time | Displays the end of the event. | View only. |
Event Details
To access the Event Details, open the Activity Summary dialog, select the Events tab and double click on the Event. The Event Details dialog opens.
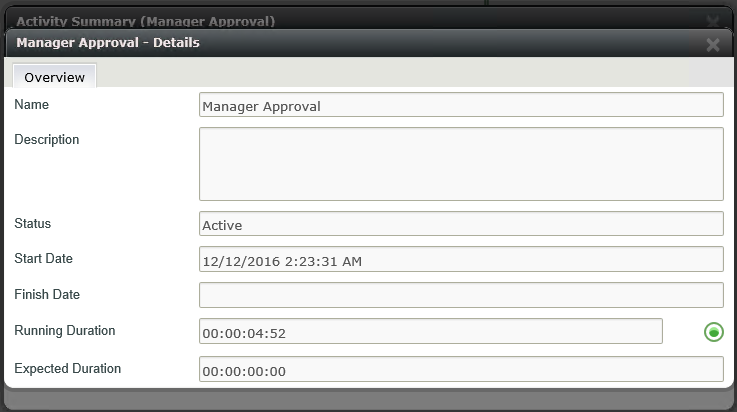
The table below explains the available fields:
| Feature | Description | Sample Value |
|---|---|---|
| Name | Displays the Name of the event as configured in the workflow designer. | View only. |
| Description | Displays the Description of the event as configured in the workflow designer. | View only. |
| Status | Displays the status of the event i.e. completed, active or error. | View only. |
| Start Date | Displays the date that the event instance was started. | View only. |
| Finish Date | Displays the date that the event instance was finished. | View only. |
| Running Duration |
Displays the actual duration of the event instance from the start until the present, or until completed. The dot icon next to the Running Duration represents whether it was completed within the expected duration or not. |
View only. |
| Expected Duration | Displays the expected duration of the event instance configured in the workflow designer | View only. |
IPC Event
If an IPC Event is used, a link is available to open the View Flow of the sub process. Click on the link to open the sub process.
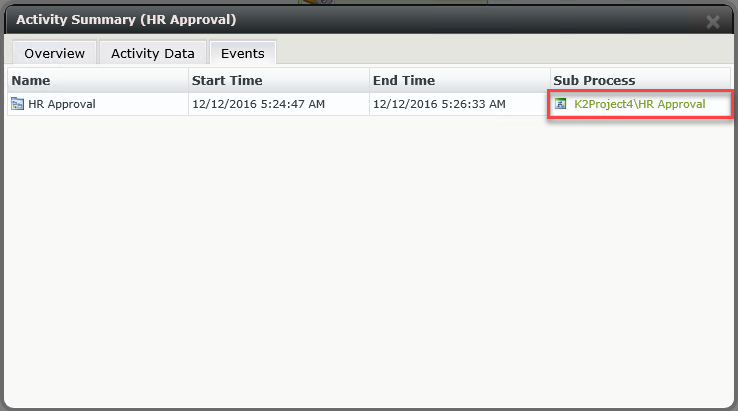
The View Flow of the sub process is opened. From here, the Process and Charts tabs of the sub process can be accessed.
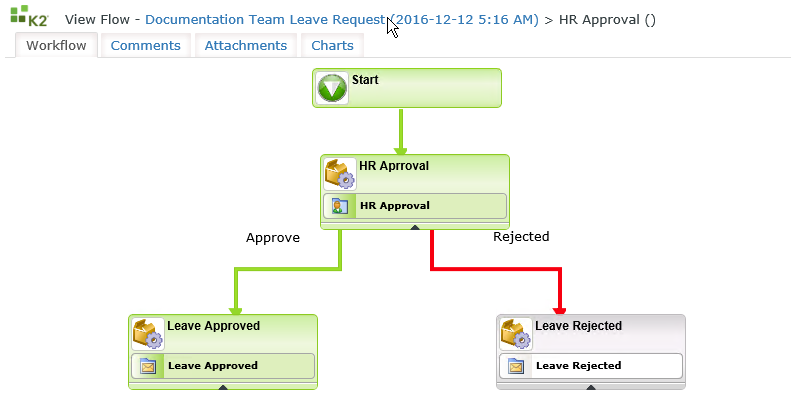
To return to the main process's View Flow, click on the link in the heading,
The Comments tab of the View Flow displays all comments that have been added to this workflow instance.
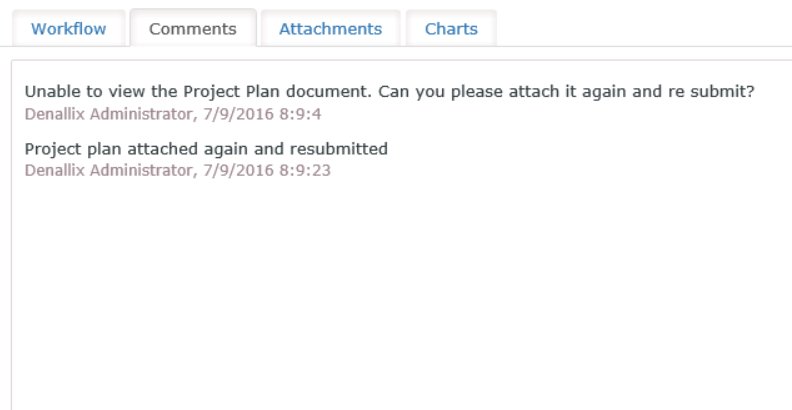
Process Instances of workflows that have Comments and Attachments enabled will display the associated comments in this tab. For more information see How to use the Workflow Attachment and Workflow Comment SmartObjects.
The Attachments tab of the View Flow displays any attachments added to this process instance.
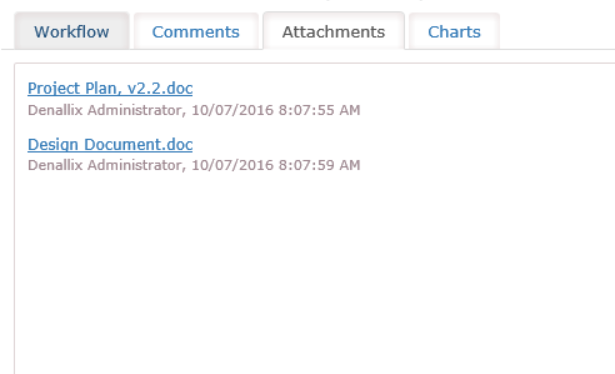
Process Instances of workflows that have Comments and Attachments enabled will display the associated comments in this tab. For more information see How to use the Workflow Attachment and Workflow Comment SmartObjects.
The Charts tab of the View Flow represents the activities in relation to each other graphically.
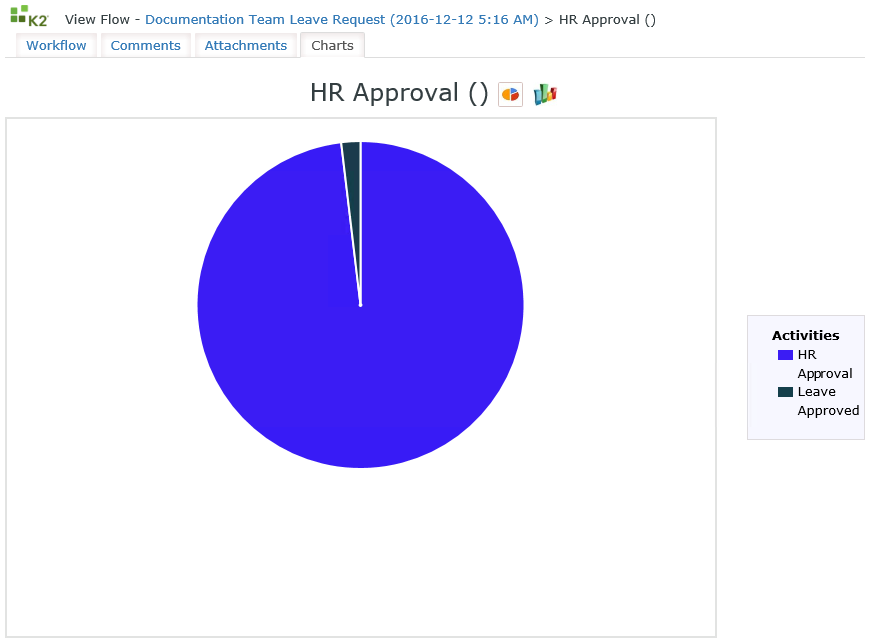
The default chart when the tab opens is the Pie Chart.
When hovering over an activity, the activity name is displayed with the running duration.
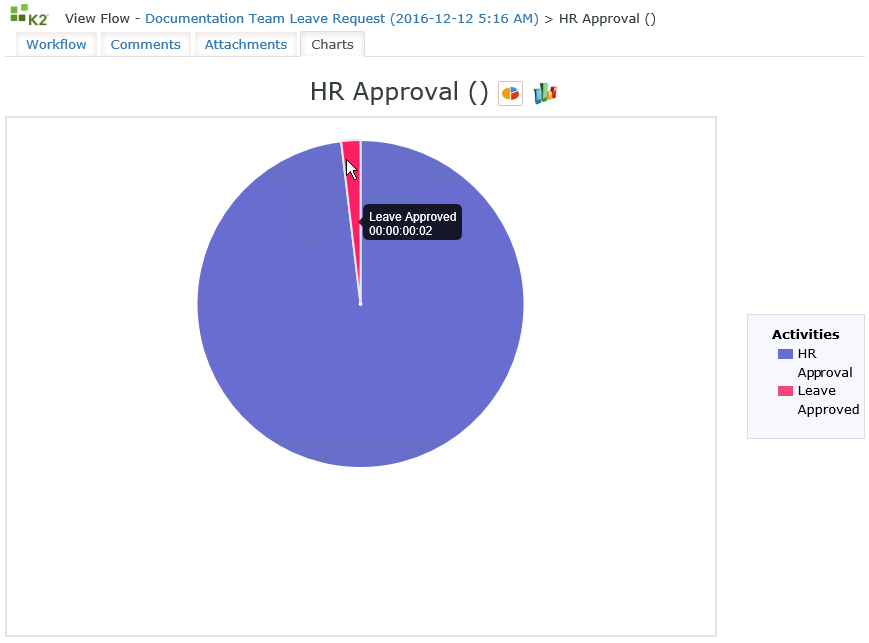
Toggle between the Pie Chart and the Bar Chart by clicking on the relevant buttons located at the top of the screen.
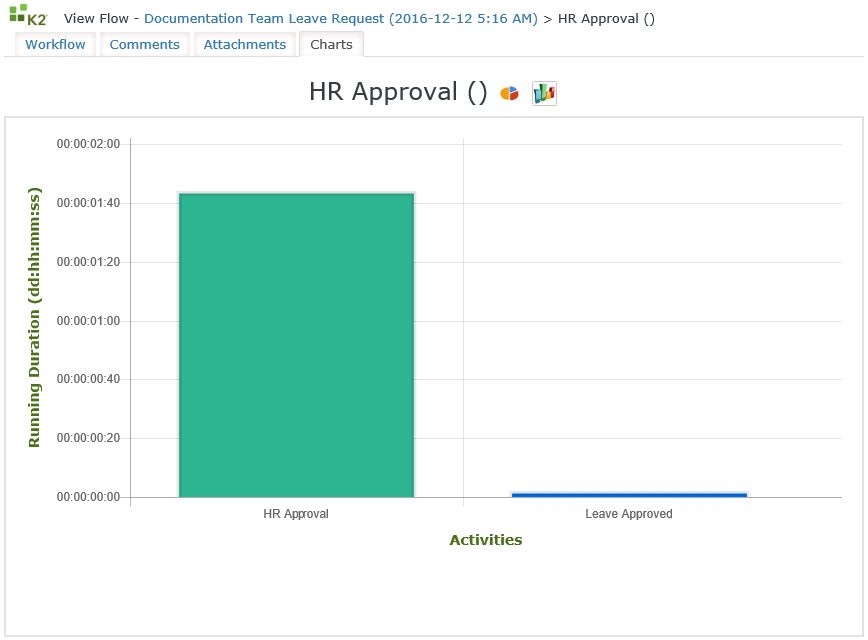
When clicking on the Activity within the Bar Chart, the Activity Details dialog opens from where the Overview, Participants, Activity Data, Process Data and Events can be selected.

The value is recorded in seconds and the default value is 30 seconds. The Minimum value that can be applied is 15 seconds. If a 0 or -1 in entered, the value will default to 30.
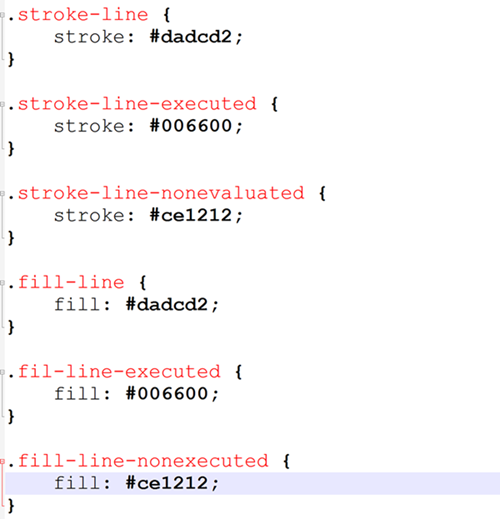
You can customize the color of the activity blocks and lines that you see in the View Flow report by modifying its CSS.
To customize the color theme, edit the flow-colors.css file from the following location:
[Drive]:\Program Files(x86)\ K2 blackpearl\ WebServices\ ViewFlow\ assets\ CSS
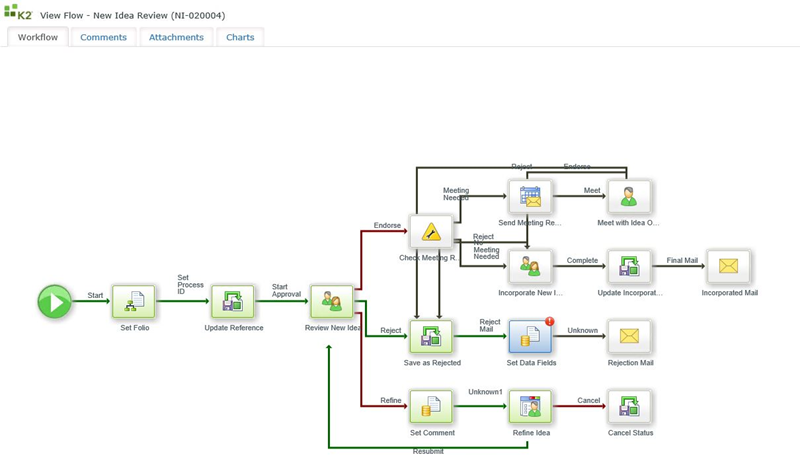
Below is an example of the color theme customization:
Default color theme:
Customized color theme:
- Users will need, at least, View or View Participate on the Process Definition in order to run the View Flow for a Process Instance.
- When interpreting a View Flow diagram remember:
- Items represented in green indicates that the step has been completed.
- Items represented in blue are currently active.
- Items represented in gray have not been executed, or are currently not yet executed.
- Line Rules that evaluated the true, and were successful are colored in green.
- Lines Rules that evaluated to false, and were not successful are colored in red.
- Skipped lines or not yet evaluated lines remain clear / gray.
- The Refresh interval for the View Flow can be changed in the web.config file. Keep in mind that the value is recorded in seconds and the minimum value that can be applied is 15 seconds.
- The Workflow Designer exposes the View Flow URL which can then be used in wizards i.e. emailing a link of the View Flow.
- Referring to View Flow Charts, the default chart is the Pie Chart. Toggle between the Bar Chart and Pie Chart by clicking on the relevant icon.
- When using SQLUM as a Security Provider and trying to open a View Flow, the following error might occur: "An anonymous identity cannot perform an impersonation". See the troubleshooting View Flow topic for more information.
