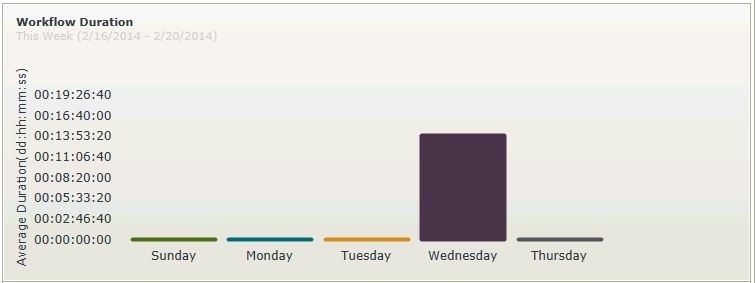
Workflow Duration Chart
The Workflow Duration Chart control is a graphic display of the average duration of workflow instances over time, according to specific filter criteria. The data is displayed as an aggregated view of the workflow. Depending on the properties used, this chart can be used to:
-
Determine which workflows are used most often
-
Determine which workflows take the longest to complete
-
Identify trends and patterns in usage and load
-
Determine the peak usage times for the workflow
-
Determine the time periods when it takes the longest to complete the workflow
Security is applied to the controls to ensure that the data is seen by authorized individuals within an organization. Permissions are based on the process rights assigned to the process in Management Console:
- Users with Admin or View permissions will have access to the Report controls.
- Users with View Participate permissions will be permitted to view the Report controls from the point where the user has been part of the workflow.
It is important to note that these permissions need to be assigned for each separate workflow. If rights to view report controls are assigned to a Group, these will not apply to the users in that Group with regard to viewing the Report controls. Rights need to be assigned at user level in order for the user to view the Report controls.
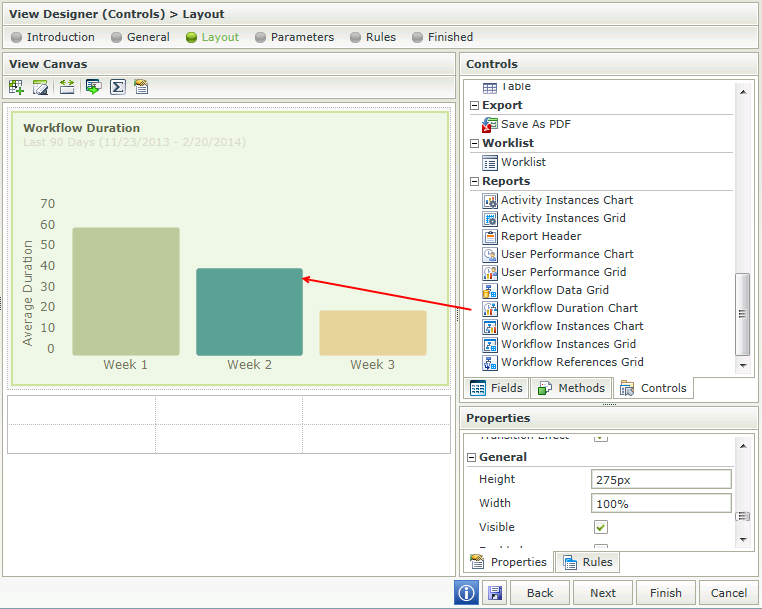
- Create a View
- Drag the Workflow Duration Chart control onto the canvas. The control can be found in the Reports section of the Controls found in the View Designer, see the Properties section below
- Configure the properties of the Workflow Duration Chart control as required, see the Properties section below
- Add a rule to Run the Chart when the View is Initialized for example:
Event: When a control on the View raises an event (When the View is Initialized)
Action: Execute a control's method (Execute the Run Chart method)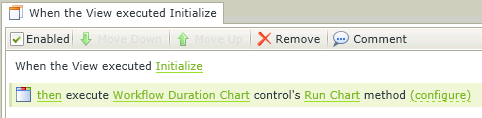
- Always remember to create a rule to Run the Chart when the View Initializes
- When using a percentage for the width of the control and used in conjunction with the Save as PDF control, a pixel width is calculated and applied to the control’s width thus making the width of the Chart pixel based rather than percentage based. It is therefore advised to use a non-percentage based width when using the Chart with the Save as PDF control
- A Workflow name(s) needs to be mapped to the Workflow Duration Chart in order to populate the chart
- When using Custom Themes, be sure to specify the CSS classes for the elements
- The data of K2 workflows or processes created by any workflow designer such as
- When using a percentage for the width of Chart controls and used in conjunction with the Save as PDF control, a pixel width is calculated and applied to the control’s width thus making the width of the Chart pixel based rather than percentage based. It is therefore advised to use a non-percentage based width when using a Chart with the Save as PDF control
- It is important to note the effect certain combination configurations may have on the performance of the chart at runtime. For example, when using a range of 90 days; grouped by hours and selecting the Full Spread option will potentially cause a lot of overhead on the performance of the chart. This selection essentially equals (90 days * 24 hours ) = 2160 columns that the chart will try to render. Depending on the browser/computer, this may potentially cause performance issues for the user. It is advised to either limit the range or deselect the Full Spread option if any performance issues are experienced.
Report controls interact with each other through rules. By binding properties between different controls, data can be used to populate properties or set values in runtime.
- The following property is available in the Context Browser when using
rules for mapping to other controls. This property is additional to those mentioned
in the
Properties section of
this topic, but is only available for interaction with rules:
Selected Range - The range of the selected column. This property returns the start and end dates to be passed into other controls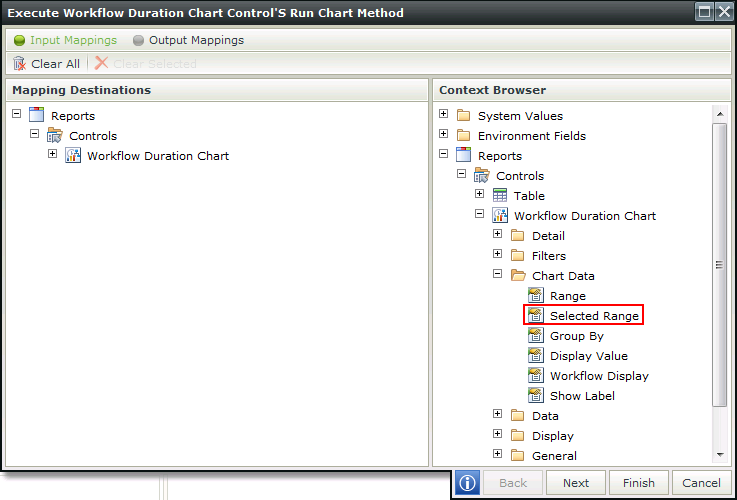
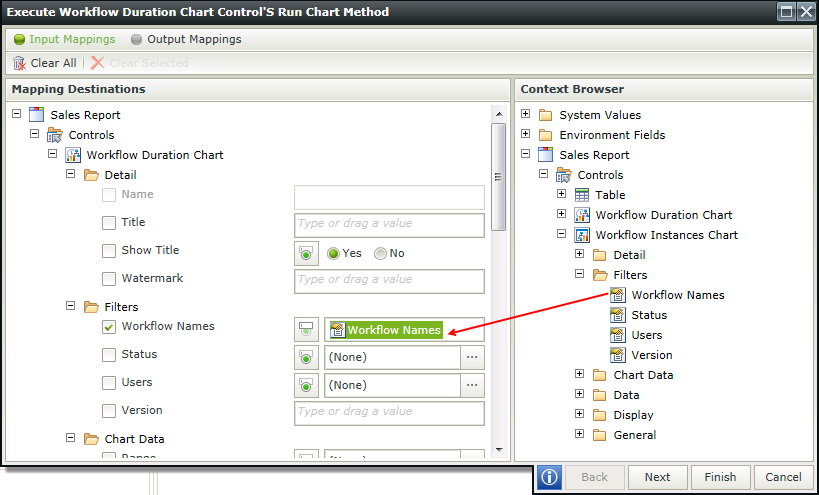
- A rule can be created to open the Workflow Duration Grid when clicking on a record in a
Workflow Instances Chart.
The rule will look like this:
Event: When a control on the View raises an event
Action: Execute a control's method
Configuration: Map the Workflow Names filter of the Workflow Instances Chart to the Workflow Names filter of the Workflow Duration Chart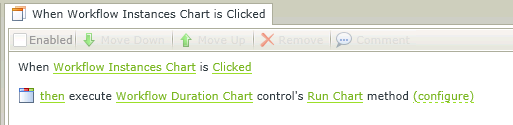
The Workflow Duration Chart control is available in the Reports section of the Controls found in the View Designer.
| Property | Description | Can be set in runtime using Rules |
|---|---|---|
| Detail | ||
| Name | A unique identifier for the selected control. This property is required | No |
| Title | The Title of the control to be shown in runtime | Yes, see Control Properties Actions for more information |
| Show Title | Shows or hides the Title during runtime | Yes, see Control Properties Actions for more information |
| Watermark | The text to be displayed in runtime if no data is available | Yes, see Control Properties Actions for more information |
| Filters | ||
| Workflow Names | The workflow on which to filter when returning the data in runtime. If All is selected, all workflow instances will be taken into account when the data is returned. See the Generic Picker Screens topic for more information | Yes, see Control Properties Actions for more information |
| Status | The Status of the specific workflow instance to be filtered on when returning the data in runtime. See the Generic Picker Screens topic for more information | Yes, see Control Properties Actions for more information |
| Users | Includes users who started or participated in a workflow instance. See the Generic Picker Screens topic for more information | Yes, see Control Properties Actions for more information |
| Version | A specific workflow version to be used to filter | Yes, see Control Properties Actions for more information |
| Chart Data | ||
| Range | The Date Range to be used to filter the data. The data returned would typically be executed according to the date on which a workflow instance was started. See the Generic Picker Screens topic for more information | Yes, see Control Properties Actions for more information |
| Group By | Indicates how the data should be grouped | Yes, see Control Properties Actions for more information |
| Display Value | The value to be used when displaying the data in the Chart. Duration or Instance Count can be used to display the data returned | Yes, see Control Properties Actions for more information |
| Workflow Display | The following methods can be used to display the average duration of workflow instances Stacked - Displayed on top of each other Clustered - Displayed next to each other Aggregated - Displayed as the total aggregated value for all workflows added in the filter |
Yes, see Control Properties Actions for more information |
| Show Label | Shows or hides the Labels in runtime | Yes, see Control Properties Actions for more information |
| Data | ||
| Participation | The following criteria can be used in addition to the Users filter being applied:
When selecting a specific user(s) in the Filters section, the criteria mentioned above can be used to filter the data returned even further |
Yes, see Control Properties Actions for more information |
| Display | ||
| Chart Type | A Chart can be displayed as a Column, Pie or Bar Chart Column Chart- A column chart displays values as sets of vertical columns that are grouped by category Pie Chart - Is a circular chart divided into sectors. Each sector shows the relative size of each value Bar Chart - Is a chart using rectangular bars with lengths proportional to the values they represent |
Yes, see Control Properties Actions for more information |
| Show Grid Lines | Grid Lines are a network of intersecting parallel lines used as a reference for locating points. This option enables the Grid Lines to be shown. Disabled by default. Select the option if Grid Lines should be shown in runtime | Yes, see Control Properties Actions for more information |
| Full Spread | Allows the user to choose between showing date values with 0 instance count and 0 duration returned. When deselected, only date values with instance count and duration greater than 0 will be shown | Yes, see Control Properties Actions for more information |
| 24-hour Clock |
Determines whether a 12-hour or 24-hour Clock should be used. For example: 20:00 vs 08:00PM Deselect the option if a 12-hour Clock should be used |
Yes, see Control Properties Actions for more information |
| Label Angle | The angle at which Labels can be rotated in order to display more efficiently when viewing many workflows. Default is 0. Type a percentage at which the Labels should rotate | Yes, see Control Properties Actions for more information |
| Select Effect | The following effects determines how the control will render in runtime. The effects are applied when an item is clicked: Pie Chart Fade - The selected item has an opacity of 100%. All other items are reduced to about 50% and faded out Explode and Fade - The selected item is exploded. The opacity of all other items are reduced to about 50% Explode - The selected item is exploded and has 100% opacity No Effect - 100% Opacity for all items Column Chart: Fade - The selected item has an opacity of 100%. All other items are reduced to about 50% and faded out Explode and Fade - The selected item has an opacity of 100%. All other items are reduced to about 50% and faded out Explode - All items have 100% opacity No Effect - All items have 100% opacity Bar Chart: Fade - The selected item has an opacity of 100%. All other items are reduced to about 50% and faded out Explode and Fade - The selected item has an opacity of 100%. All other items are reduced to about 50% and faded out Explode - All items have 100% opacity No Effect - All items have 100% opacity |
Yes, see Control Properties Actions for more information |
| Transition Effect | Applies the Effect mentioned above in runtime | Yes, see Control Properties Actions for more information |
| General | ||
| Visible | Shows or hides the control in runtime | Yes, see Control Properties Actions for more information |
| Enabled | Enables or disables the control in runtime | Yes, see Control Properties Actions for more information |
| Read-Only | Enables the control to be read-only in runtime | Yes, see Control Properties Actions for more information |
| Height | Adjusts the height of the control. Any whole number or pixel value to a maximum of 32767px can be entered. When set to zero, it will automatically change the size to fit the content of the page. Type the dimension to be used | Yes, see Control Properties Actions for more information |
| Width | Adjusts the width of the control. Any whole percentage up to 100%, whole number or pixel value to a maximum of 32767px can be entered. Type the dimension to be used | Yes, see Control Properties Actions for more information |
| Styles | Opens the Style Builder enabling the user to specify style features like Format, Font, Borders, Padding and Margins. See the Style Builder topic for more information on styling options | No |
| Conditional Styles | Opens the Conditional Formatting Designer. This is used to design styles that will apply only when certain conditions are met. See the Conditional Styles section for more information. Click on the ellipsis to open the Conditional formatting screen | No |