Process Overview report
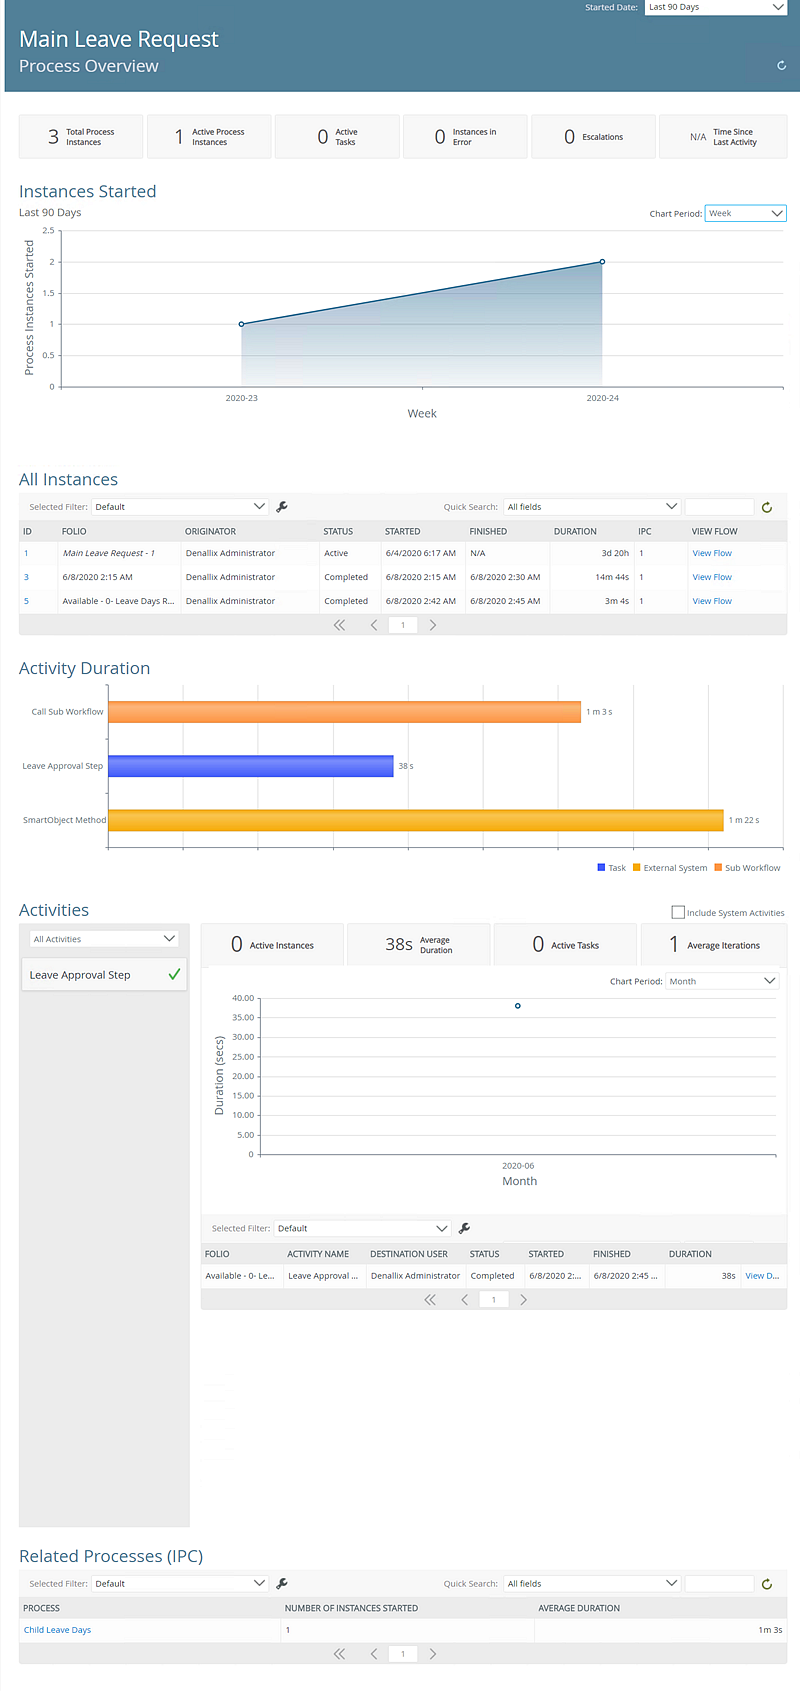
The Process Overview report provides an overview of a specific workflow in an environment. You can access this report with the Reports tab on the Process Details page.
This report allows you to view:
- Data about a process such as total and active process instances.
- All instances of a process.
- Activity duration of a specific instance of a process.
- Activities of all process instances of a specific process.
- All related processes (IPC) of a specific process.
Example
This section provides an example of the Process Overview report.
| Field | Description |
|---|---|
| Started Date | Allows you to configure the report, by specifying which data is returned. By selecting the appropriate period of time, for example, the last 90 days, last year, today and yesterday. |
| Refresh | Clicking Refresh refreshes the report. |
| Overview Bar | Displays an overview of total processes instances, active process instances, active tasks, instances in error, escalations and time since last activity. |
| Instances Started | Displays a line graph of all started processes instances over a specified period. The data returned is specified by the Started Date. The returned data can be further filtered via the Chart Period by day, week, and month. |
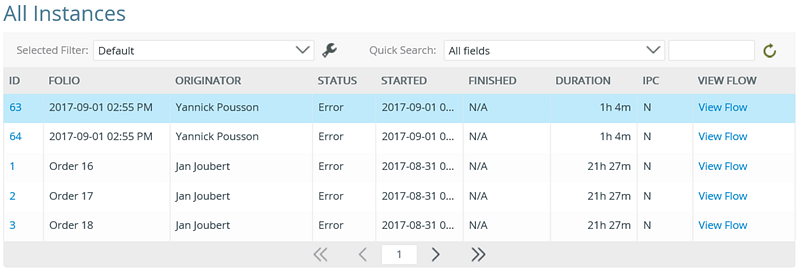
| All Instances | Displays an item list of all process instances of a process. Each process instance is displayed by ID, Folio, Originator, Status, Started, Finished, Duration, IPC, and View Flow. An individual process instance can viewed by clicking the ID in the ID column which opens the Process Instance Detail Report. The data returned is specified by the Started Date. The returned data can be further filtered via the Quick Search and configuring a Selected Filter. |
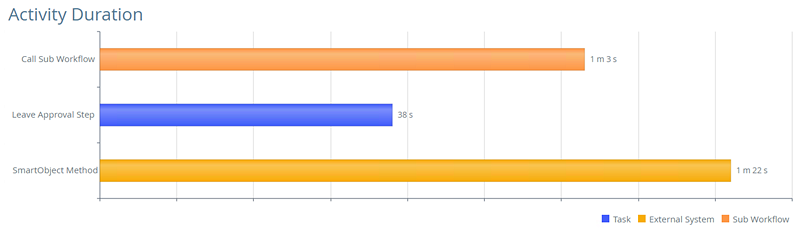
| Activity Duration | Displays a horizontal bar graph of all activity durations of a specific process. |
| Activities |
Displays all activities associated to a process. Each activity can be selected and the following data is presented:
|
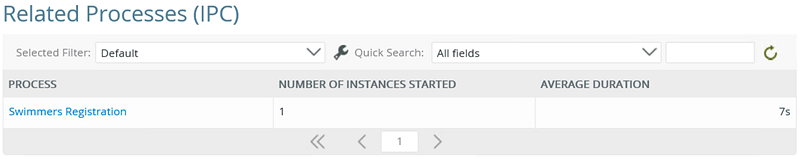
| Related Processes (IPC) | Displays a item list of all related processes (IPC) of a process by Process, Number of Instances Started, and Average Duration. The data returned is specified by the Started Date. The returned data can be further filtered via the Quick Search and configuring a Selected Filter. |
The following sections are available in the Processes Overview report:
The Instances Started section displays a line graph of all started processes instances over a specified period. Hovering over a point on the line graph displays data by the number process instances started and by period. The data returned is specified by the Started Date. The returned data can be further filtered using the Chart Period by day, week, and month.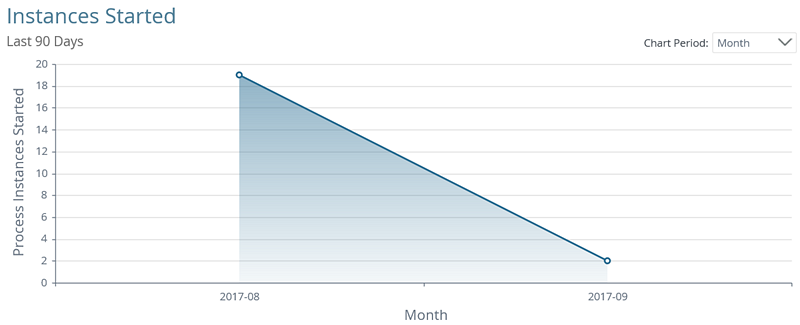
The All Instances section displays an item list of all process instances of a process. Each process instance is displayed by ID, Folio, Originator, Status, Started, Finished, Duration, IPC and View Flow, and are filterable and sortable. An individual process instance can be viewed by clicking the ID in the ID column, which opens the Process Instance Detail Report. The data returned is specified by the Started Date. The returned data can be further filtered using the Quick Search and configuring a Selected Filter.
The Activity Duration section displays a horizontal bar graph of all activity durations of a specific process. Hovering over a specific activity displays data by activity average duration and activity name. Activity duration for the Task, Call Sub Workflow and SmartObject Method (with Wait for External System enabled) steps display here.
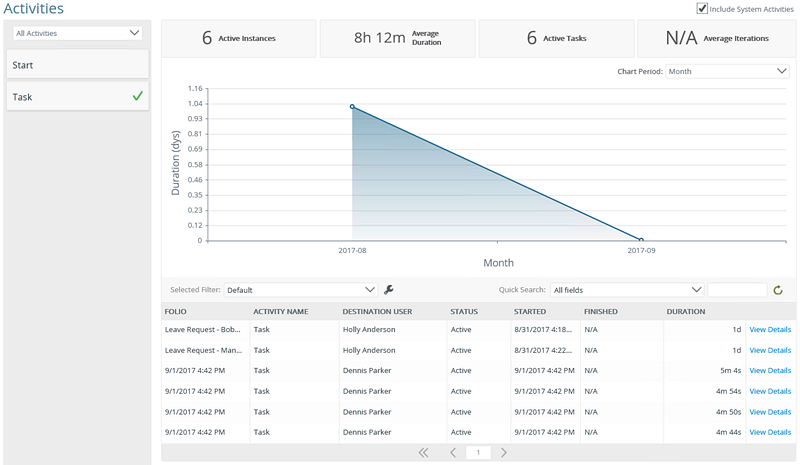
The Activities section displays all activities associated to a process. Each activity can be selected and the following data is presented:
- The amount of active instances the selected activity is part of.
- The average duration of the selected activity.
- The amount of active tasks the selected activity is part of.
- The average iteration of the selected activity.
- Line graph of activity duration over a period of time. The data returned is specified by the Started Date . The returned data can be further filtered using the Chart Period by day, week and month.
- An item list view of all activities. The data is displayed by Folio, Destination, Status, Started, Finished. Clicking the View Details link opens the Activity Instance Detail Report. System Activities can be viewed by checking the Include System Activities check box. The data returned is specified by the Started Date. The returned data can be further filtered via the Quick Search ,configuring a Selected Filter and using the Chart Period by day, week, and month.
The Related Processes (IPC) section displays an item list of all related processes (IPC) of a process by Process, Number of Instances Started and Average Duration. The data returned is specified by the Started Date. The returned data can be further filtered using the Quick Search and by configuring a Selected Filter.
Permissions
To view the Process Overview report, you must have Process Administrator rights.
To set process administrator rights, see Process rights.
Use the report
The section below detail show to use the report, such as configuring the report via the Started Date drop down, creating filters and using the quick search.
Use the Started Date drop down
The Started Date drop down allows you to configure the dates of the report. Selecting an option from the Started Date refreshes the report. The report can also be refreshed using the icon. The Started Date options are determined by the culture settings in the browser settings.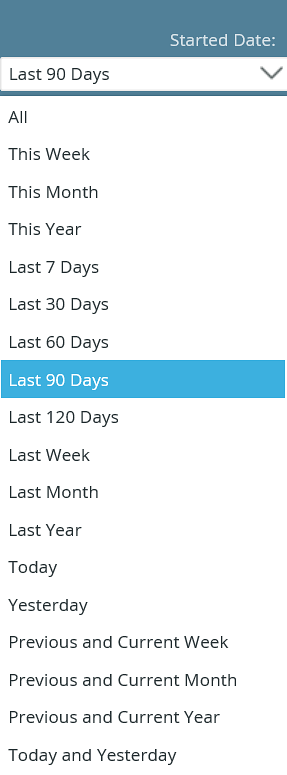
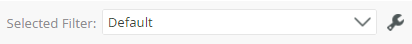
Use the Selected Filter
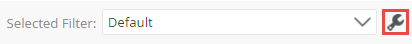
The Selected Filter allows you to select predefined filter or create a custom filter by clicking the custom filter icon.
Follow the steps below to create a custom filter:
- Click the custom filter icon.
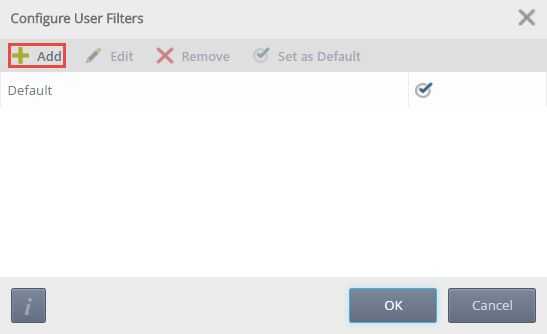
- On the Configure User Filters screen, click Add.
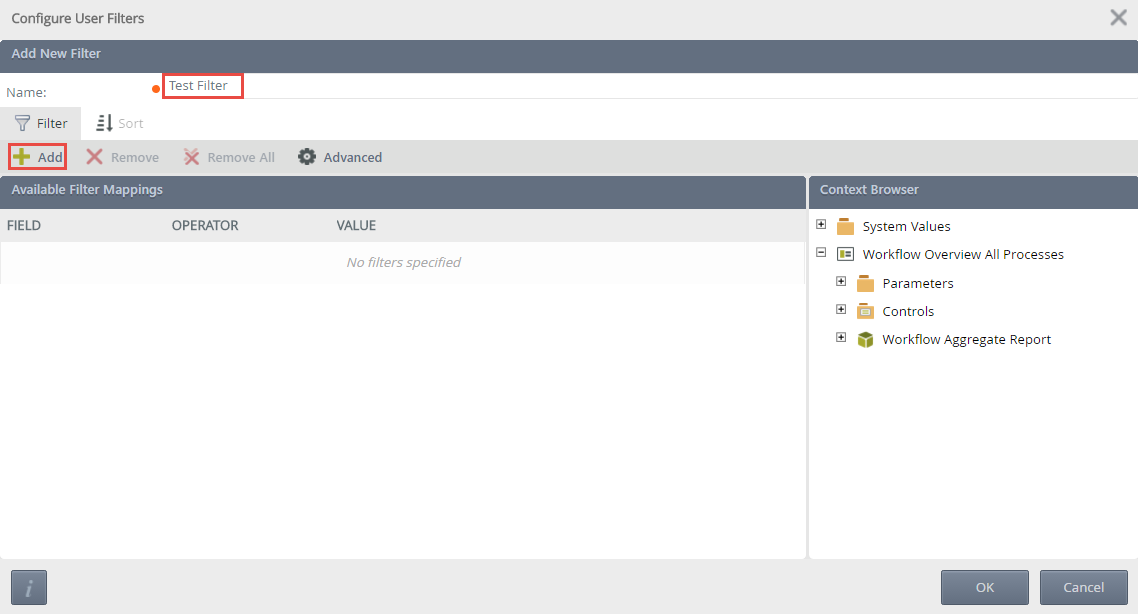
- On the Add New Filter screen, provide a filter name and click Add.
- Provide a field, operator and value. Custom values can be added via the Context Browser.
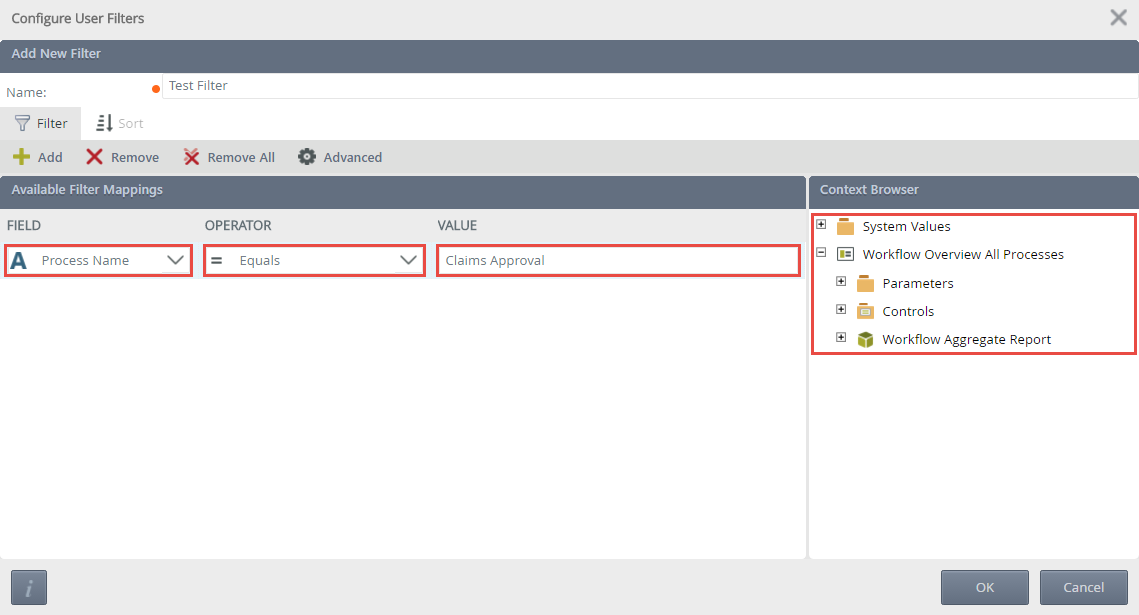
- Clicking the Advanced button, opens the Advanced Filter Configuration screen.
- Create conditions and expressions if required. Custom values can be added to a condition or expression via the Context Browser. An example of the custom condition is displayed in the Preview.
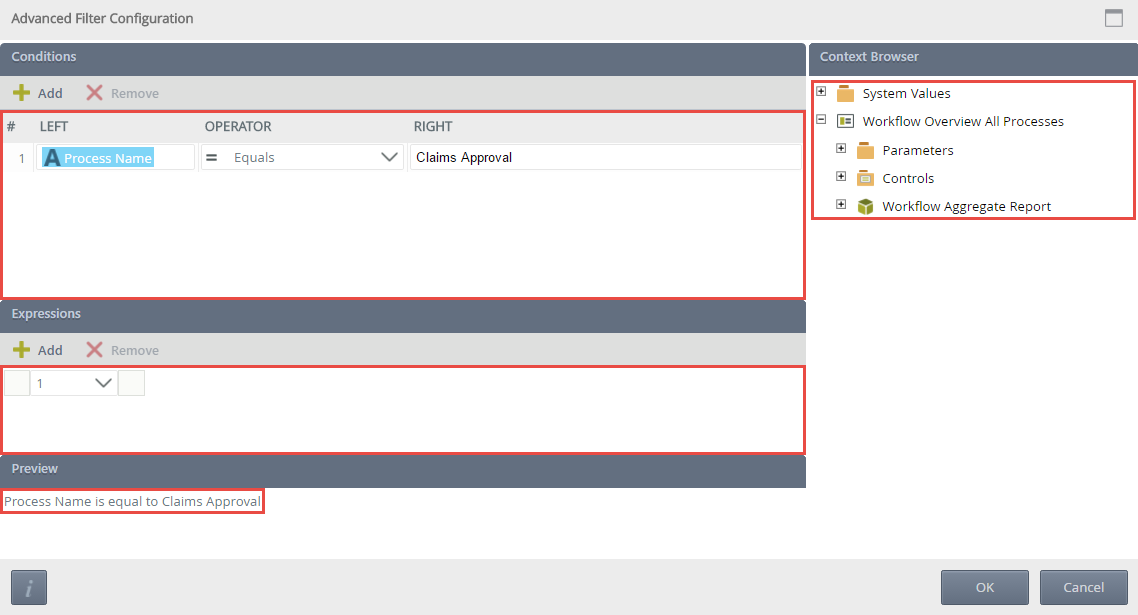
- Click OK.
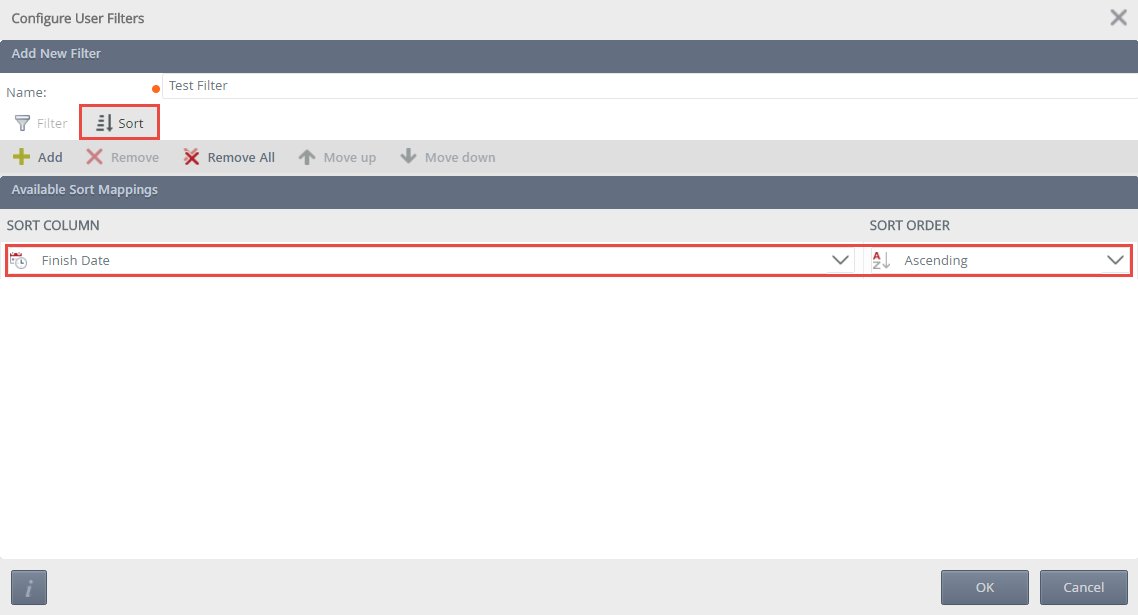
- On the Configure User Filters screen, click the Sort tab.
- Click Add, and specify a sort column and sort order. Sort mappings can be moved via the Move Up or Move Down options. Once the sort mapping is complete, click OK.
- On the Configure User Filters screen, Edit, Remove or set the filter as default. Click OK.
- The report section will refresh depending on the default filter selected.
Use the quick search
The Quick Search allows you to configure what data is returned on a report section. Selecting an option from the Quick Search drop down and clicking the Refresh icon will refresh the report section. The options available from the Quick Search drop down are determined by the column names of the report section.
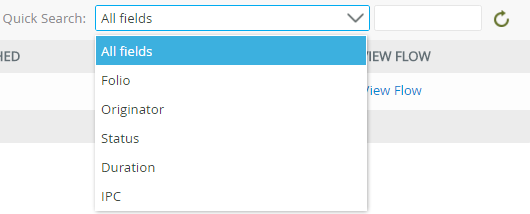
Custom fields can also be entered, once entered click the Refresh icon and the report loads data based on the search query.
Use the chart period
The Chart Period drop down allows you to further filter returned data by day, week and month.
Follow the steps below to use the Chart Period:
- On the report section where the Chart Period is available, click the Chart Period drop down and select an option.
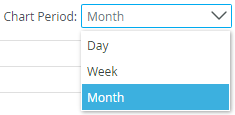
- The report section will refresh with data from the selected Chart Period filter option.
Considerations
Below are considerations when using the Process Overview report.
- Editing the color and graph types of the report is not currently possible.
- Exporting the report to Excel and PDF is not currently possible.
- There is no design time for this report.