Using View Flow
Use View Flow to see which step the workflow is currently on, who has participated in the workflow, drill down further into the workflow to view the activity data fields. The View Flow can be accessed from the Workflow Instance report as well as from the K2 Worklist menu.
When the View Flow icon is clicked the View Flow page will open with Workflow, Comments, Attachments, and Charts tabs.
The workflow will be displayed in the body of the tab. Various colors and icons depict where in the process the workflow is. For example in the image below the workflow is currently on the Update List Item step, but the red icon shows that there is an error on the workflow. You can click on any of the steps or outcome lines to see more information.
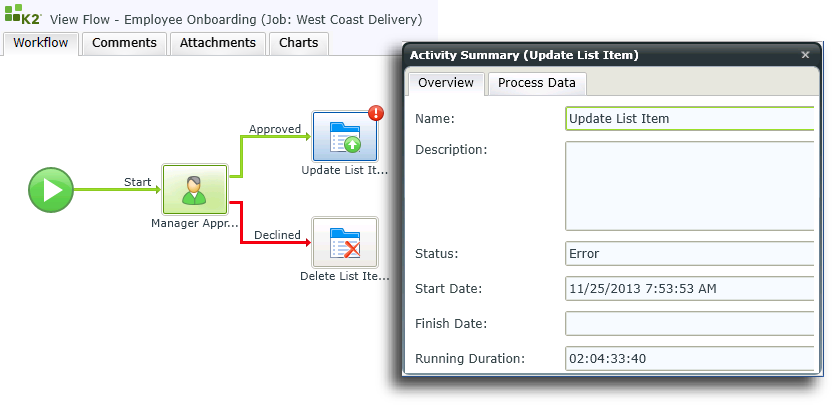
To interpret a View Flow diagram, remember:
- Line Rules that evaluated true and were successful are colored green
- Line Rules that evaluated false and were not successful are colored red
- Skipped lines or not yet evaluated lines remain clear
- Green workflow steps indicate that the step was successful
- Blue workflow steps indicate that the activity has started, and is in an Active or Running state
- White workflow steps indicate that the step has not yet been executed
- Blue events with red exclamation marks indicate that the event is currently in an error state
Process Instances of workflows that have Comments enabled will display the associated comments in this tab.
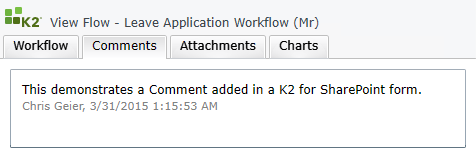
For more information see How to use Comments and Attachments.
Process Instances of workflows that have Attachments enabled will display the associated attachments in this tab.
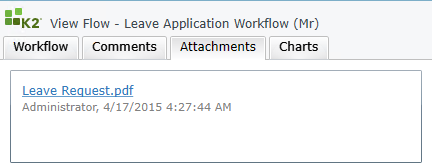
For more information see How to use Comments and Attachments.
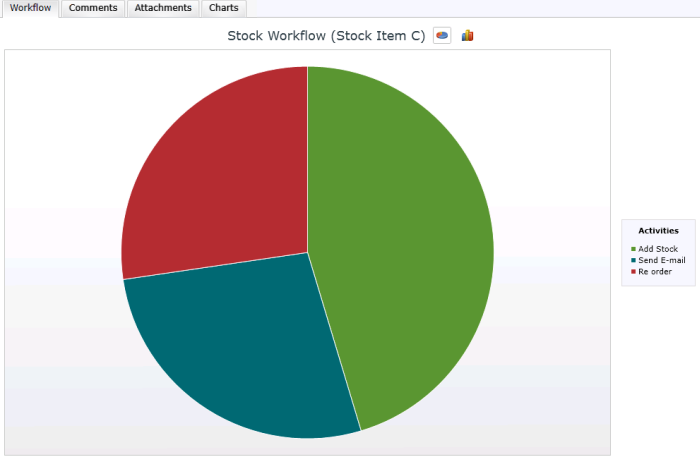
The Charts tab of the View Flow represents the activities in relation to each other graphically. The Pie Chart is opened by default. When hovering over an activity, the activity name is displayed with the running duration.
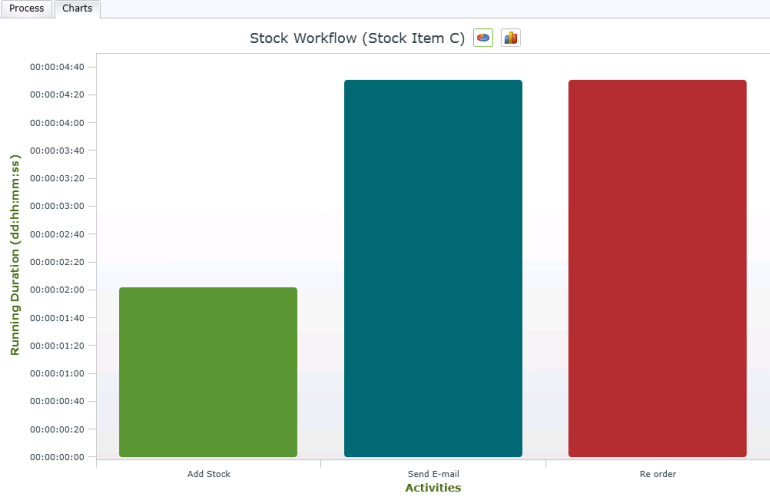
Click on the Bar Chart icon to open the Bar Chart. To return to the Pie Chart, simply click on the Pie Chart Icon.

|
Bar Chart icon |

|
Pie Chart Icon |
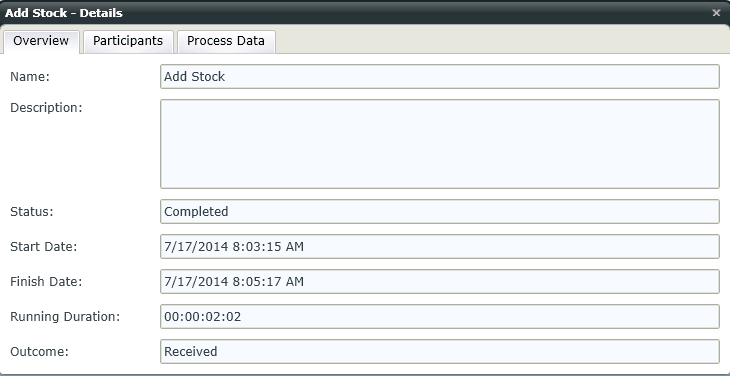
When clicking on the Activity within the Bar Chart or Pie Chart, the Activity Details dialog opens from where the Overview, Participants and Process Data can be selected. In the Pie Chart, the Activities in the box on the right can alternatively be clicked to open the Activity Details.