Standard Reports in K2
In this collection of tutorials, we will look at the Standard Reports available with K2 blackpearl installations. This tutorial has two parts. In Part 1, we will explore K2 Workspace, first taking a brief tour of the Management Console and where permissions are assigned. As we will learn, users must have specific permissions to view reports. In Part 2, we will look at the View Flow Report, where we will observe our report in a flowchart, or graphical, format.
Standard Reports include high-level overviews of usage statistics (for example, average durations or number of instances of a Process) or very detailed reports that provide the ability to "drill-down" into a Process Instance for Activity Instance details and audit trails.
Standard Reports
K2 has several Standard Reports that provide a well-rounded overview of what is occurring with your workflows. Standard Reports can be used for Business Intelligence (BI) and would include information such as statistical analysis (number of Processes started, average duration of an Activity) or historical reporting (number of Processes started in a given time frame, peak usage). Standard Reports can also be used for Business Activity Monitoring (BAM). For example, running a report to see where the Process is right now, or which users actioned a user task and the path that the Process took based on that action.
Standard Reports differ from Custom Reports in that they typically have little flexibility in their display or the data contained in the report. While there are settings you can configure to add parameters and filters, it is not possible to add custom fields or create custom layouts in Standard Reports.
The following is an overview of the five Standard Reports found in K2 Workspace.
Standard Reports and their Use Case:
| Report | Use Case |
|---|---|
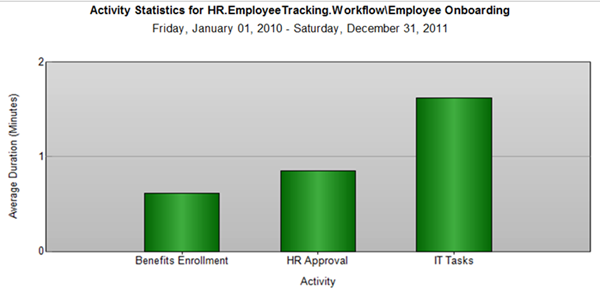
| Activity Statistics |
This report is typically used to discover bottlenecks in a specific process, or to identify which tasks have the most load in a workflow. In the image below, we are looking at the average time it takes for each Activity (or step) within a Employee Onboarding Process. Notice how the IT Tasks Activity consistently takes much longer to complete over the other two tasks.
|
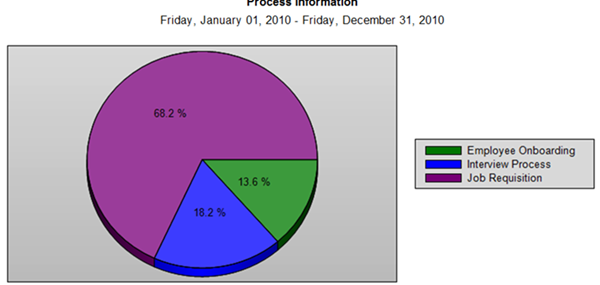
| Process Information |
This report compares different Processes over the same time frame, and is most often used to compare the peak use of different Processes or the average time taken to complete different Processes. In the image below, we can easily see that the Job Requisition Process is taking much longer on average to be completed. This report would be helpful to determine if a Process needs to be reworked or otherwise needs some intervention. It might also lead you to looking at the Activity Statistics for the long-running Process to determine if any Activities need intervention.
|
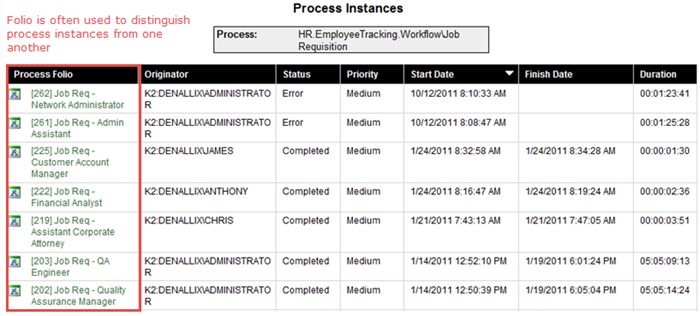
| Process Overview |
The Process Overview Report lists all instances of a workflow (for active workflows as well as completed workflows) and allows you to drill down into the Process Instance data and statistics. This report is very useful for development, testing, troubleshooting and investigation of Process Instances, and for performing audit trail investigations of Processes. This report illustrates why the Folio is important: it allows us to differentiate each Process Instance with some human-readable unique identifier. Notice too, that we can see the Status for each Process Instance, some being completed and some in "Error" status. If you click on the Folio column, you can drill down into that instance to see a listing of the activities, events and audit trails for that workflow instance.
|
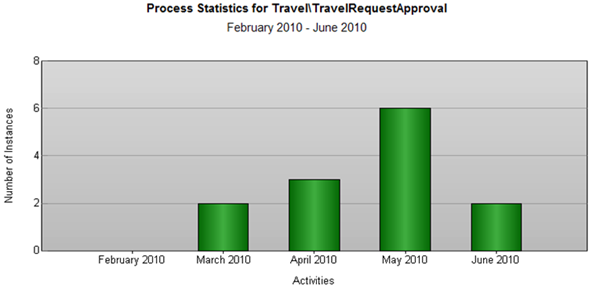
| Process Statistics |
This report displays a count or duration graph of a specific Process grouped into selected intervals. This report can be used to determine peak-usage times for the Process. In the image below, we have configured the report to show the average duration of the Travel Request Workflow Approval process over several months. As more and more workflows are processed, this information would be valuable in determining peak usage times.
|
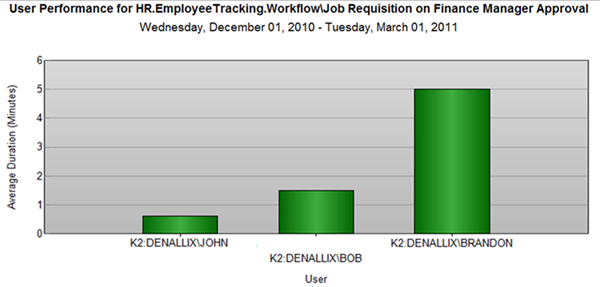
| User Performance |
The User Performance Report is an average duration or number of tasks competed for all users that performed a specific user task in a Process. This is useful in team-management scenarios (for example, identifying which users in a team do the most work) or in user performance management (for example, understanding how long a particular user takes on average to complete a specific task). In the image below, we are looking at the number of Finance Manager Approval tasks each user completed for the Job Requisition process, over a 4-month timespan.
|
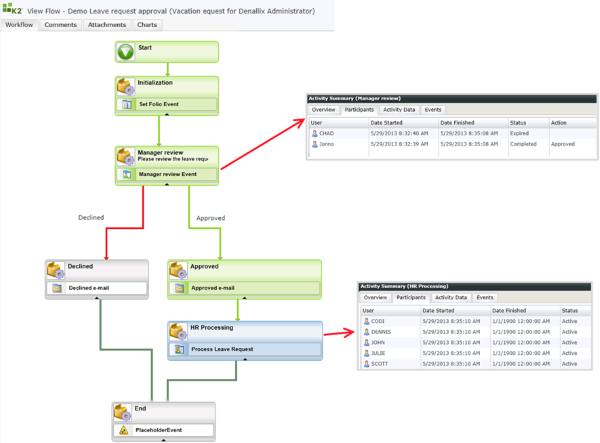
The View Flow Report
We've reviewed the five Standard Reports available with K2 blackpearl installations. In addition, there is a sixth report called the View Flow Report. This report displays the same content as the Process Overview Report (with a few minor differences), in a flowchart format and is a "live" view of a workflow instance: it will update automatically as the workflow progresses. In the second part of the Standard Reports tutorial, we will explore the View Flow Report and its features.
Getting Started
In the K2 Workspace reporting tutorial, we will explore the basic navigation of K2 Workspace, then take a closer look at the Activity Statistics Report, the Process Overview Report and the User Performance Report. In the View Flow Report tutorial, we will explore the View Flow Report and compare the results returned with the Process Overview Report.
When you are ready to begin the Standard Reports tutorial, continue on to Reporting with K2 Workspace to get started.