Reporting in K2 Workspace
K2 Workspace is the primary Administration and Reporting tool for K2 blackpearl installations. From the Management Console, you can determine the current version of a deployed workflow, set workflow permissions (Process Rights), stop and start Process Instances and redirect them to another user if necessary. All workflows, whether built in K2 Designer, K2 Studio or K2 Visual Studio can be managed from K2 Workspace.
You must have the necessary process permissions to complete these tutorials. If you are logged into a K2-provided VM as Denallix Administrator, you will have the necessary rights. If you are working from within your own environment, take note of the permissions described below and if necessary, request additional permissions from your K2 Administrator.
- View: Users with View rights on a Process can run Reports against all instances of a workflow. This is the recommended permission if you want to run statistical reports against a Process.
- View Participate: Users with View Participate rights can only report on those workflow instances where they are the originator (started the workflow), or actioned a user task. With this permission, you are likely to only see a subset of all the statistical reporting information for a specific process, because only those instances that meet these criteria will be included in the report. data
- Admin: Required to access the Management Console in K2 Workspace in order to assign workflow permissions. If you are working in your own environment and you are not a K2 Administrator,either request this permission from your K2 administrator or just read through the exercises and do not perform the exercise tasks. You will be able to complete the majority of the exercises in this tutorial without needing the Admin permission.
In this step, we will take a brief tour of the Management Console in K2 Workspace. We will look at the Process Rights for the Leave Request Workflow.
Step 1 Tasks
- In this step, we are taking a brief tour of the Management Console, specifically looking at the Process Rights for the Leave Request Workflow Process. If you are familiar with the Management Console and Process Rights, feel free to move on to the next step.
- Launch K2 Workspace. (Start > All Programs > K2 blackpearl > K2 blackpearl Workspace). If you do not see this link in your start menu, contact your K2 Administrator to obtain the URL of the K2 Workspace in your environment.
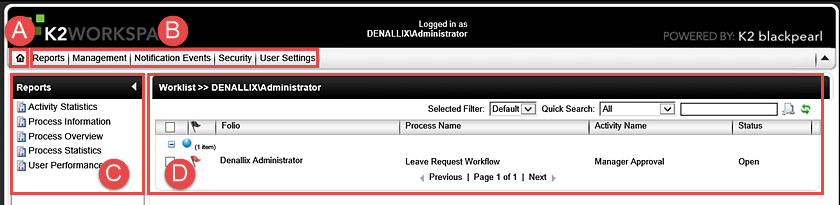
- Notice the following sections of the landing page:
- Home Page Button
- Menu Bar
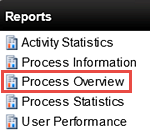
- Reports Console Menu
- Worklist for current user. (If there are any Process Instances waiting to be actioned by the current user, they are listed here. There may not be any. In the image below, DENALLIX\Administrator has one Process Instance waiting to be actioned.)
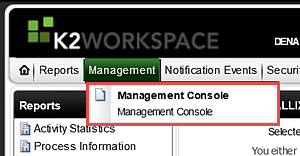
- Click on the Management Menu button in the Menu Bar, then click Management Console.
- Expand the K2 Server tree (your server name may be different than the image below), then expand Workflow Server > Processes > Workflows > Leave Request Workflow. This is the Leave Request Workflow that was deployed as part of the Leave Request (Extended) tutorial.
- Process Rights: Assign workflow permissions to a Process.
- Admin: Full-control over the Process. This should not be confused with Admin Server Rights, where the user has full control in K2 Workspace.
- Start: Users can start a workflow. Without Start (or greater) permissions, users are likely to get an error when they submit a form.
- View: Users can view, run and create reports for the Process.
- View Participate: Users can view standard reports for workflows they started or where they completed a task.
- Instances: View running instances of the current Process. This option gives you an overview of how many Process Instances are currently running, as well as those that are in an error state.
- Versions: By default, K2 makes the most recently deployed workflow the default. You can change the default to another version if desired. When running reports, you have the option of changing the version you want to report on.
- String Table: Shows the K2 blackpearl connection strings.
- Roles: Roles are initially created globally and then can be added to a specific workflow if desired. Roles are predefined groups of users. For example, you might create a role called 'Finance Approvers', then assign a user task to the Finance Approvers role, instead of one or more individual users.
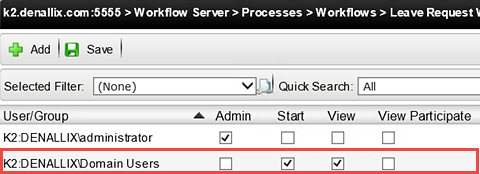
- Click on Process Rights. With Start and View rights, all Domain Users can start this Process (the Leave Request Workflow) as well as access and run Standard and Custom Reports. The View Participate option would be in lieu of the View option and would allow them view Standard Reports for workflows they started or where they completed a task. (You would select one or the other, but in most cases, the View option is selected.) If you don't want users to have access to reports, simply remove the View option by deselecting it and clicking Save.
- Click on the Home icon to return to the K2 Workspace landing page.
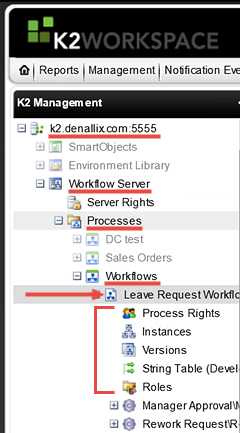
Notice the Workflow Server options for the Leave Request Workflow Process.
In this exercise we will be working with the Process Rights option.
STEP 1 REVIEW
In this step, we took a brief look at the Management Console, specifically the Process Rights for the Leave Request Workflow Process. This is important to be familiar with, as you will use Process Rights to grant users the ability to view, run and create Standard and Custom Reports. If you do not want your users accessing reports, confirm their only Process Right is the Start option. This will allow them to submit a form (and start a workflow), but not access reports.
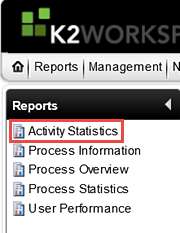
In the next several steps, we will learn more about three Standard Reports and how you might use them for analyzing and monitoring your Processes. The first report we are going to work with is the Activity Statistics Report. When you drill down into it, the Activity Statistics Report displays in a graphical format.
Step 2 Tasks
- Launch the Activity Statistics Report. Using the Leave Request Workflow, run a report that displays the Average Duration for Completed tasks. Be sure to include Server Events.
- Run a second Activity Statistics Report to determine if there are any tasks still running after two days. This time, exclude the server events.
- From the K2 Workspace landing page, click the Activity Statistics Report link in the Reports pane. (It may take a minute or so for the report to open.)
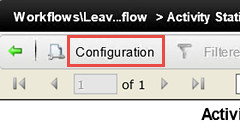
- Click on the Leave Request Workflow Process Name to open the report. The report opens using the system default filters, or the last configuration of parameters and filters if they were set. Click the Configuration link.
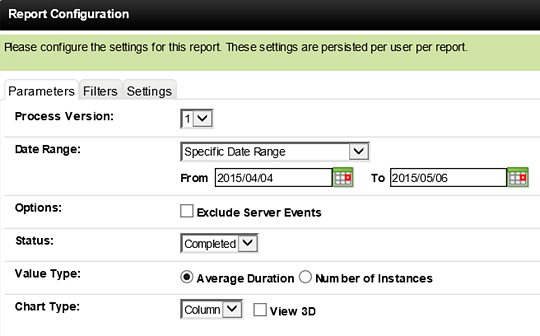
- On the Report Configuration Parameters screen, set the options as follows: (Use the image below as a guide if necessary.)
- Process Version: Select the Process Version you want to report on. For the Leave Request (Extended) Process, you might only have one choice.
- Date Range: Make sure the From value is at least two-to-three weeks back. This will be dependent on how long ago you built the Leave Request (Extended) Application and/or submitted test Processes. Adjust the dates so that they encompass the time frame around building and testing the application.
- Option: UNCHECK Exclude Server Events
- Status: Select Completed
- Value Type: SELECT Average Duration
- Chart Type: Select Column
- We will not specify any Filters or Deleted Process Settings
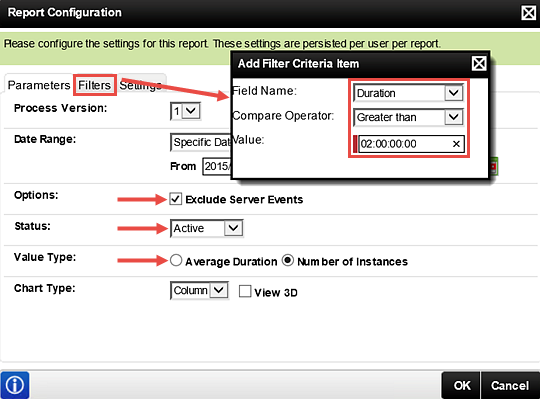
- Now we want to see if there are any Process Instances still running after two days. Open the Report Configuration and make the following changes to the Parameter and Filter options:
- Options: CHECK the box to Exclude Server Events
- Status: Active
- Value Type: Number of Instances
- Filter (use the Filter tab): Duration is Greater Than 2 days (02:00:00:00)
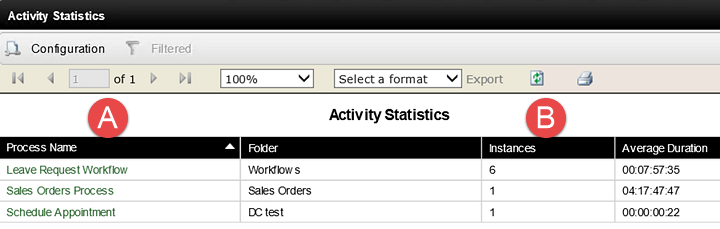
The Activity Statistics landing page will open. Here you will find a list of all Processes that have been deployed. (A below) This high-level overview also indicates the number of Instances that have been started for each Process. (B below) The number of instances includes Processes that are active and non-active.
For our first report, we want to see which tasks take the longest to complete compared to the other tasks in the Process.
The Report Configuration screen opens on the Parameters page. This is where you can narrow down the results returned by specifying Parameters, Filters and Deleted Process Settings for the Process Instance you are reporting on. The following is a guide to the options available:
| Parameter | Notes |
|---|---|
| Process Version | Allows you to select the Process Version you want to report on. By default, K2 will make the last workflow deployed the default. When a user submits a form, the default workflow will be the Process started. Select the version number you want to report on. |
| Date Range | Use the date range setting to narrow down the reporting time frame. For example, you may want to run the report weekly, then save a copy for later comparison. This will allow you analyze a Process over time to help determine the time frames the Process is used the most, or least. HINT: Use the Date Range drop-down for predefined time frames. For example, This Week, Last Week, etc. |
| Options | This option allows you to include or exclude Server Events. Server, or System Events are those tasks that K2 runs behind the scenes. For example, sending an email or updating a list. System tasks are generally performed quite fast. If you have multiple user tasks, you may not want to take up chart space with the system tasks. |
| Status | Select the Process Instance status you want to report on. Options include Active, Completed, Expired and Waiting. Generally speaking, you will report on Completed Process Instances, as they can give a more accurate view of the time a task has taken. This, when combined with multiple Process Instances, can indicate if any tasks are taking a longer time than you had anticipated. |
| Value Type | You have two types of values you can report on. The Average Duration will calculate the average time a task has taken, or is taking. The Number of Instances displays the total number Process Instances for the selected Status. |
| Chart Type | Allows you to choose the chart type you would like to output for your report. |
| Filters | Notes |
| Add, Edit, Remove | The Filter option allows you to further define your report results by applying filters to either the Activity Name, Duration, Full Name or Instance. For example, you might run a report based pulling Active Process Instances that have been running for longer than 1 day. In this case, you would apply a Filter on the Duration option setting to be greater than 1 day. |
| Settings | Notes |
| Deleted Process Instances | Select whether you want to include deleted (or removed) Process Instances in your report. By default, this is set to True. You may want to set this to False so that you are reporting on only the workflows that are viable (Active or Completed). |
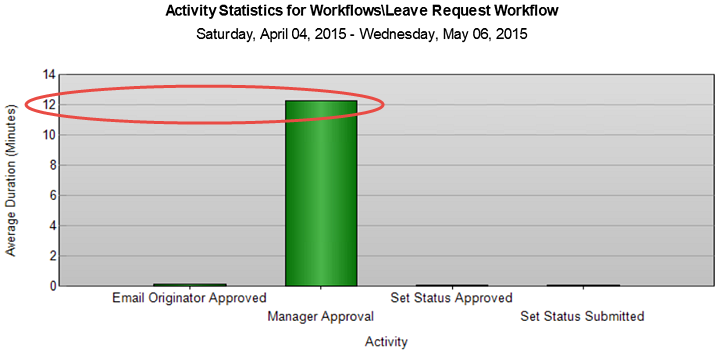
While your chart will not look exactly like the image below, we should see a representation of one user task (Manager Approval) and three other system tasks. The system tasks are processed very quickly. Notice the average time it takes for the Manager Approval task. Since we are using test applications, the 12 minutes it's taking is very reasonable. If, in the real world, if this average indicated 3-4 days, then you might look at the complexity of the task and see if the communication around the task could be made clearer. Another option to consider is to add an Escalation to the task. Escalations can be as simple as sending an email reminder of the unfinished task, or more complex, where the task is automatically redirected to another user.
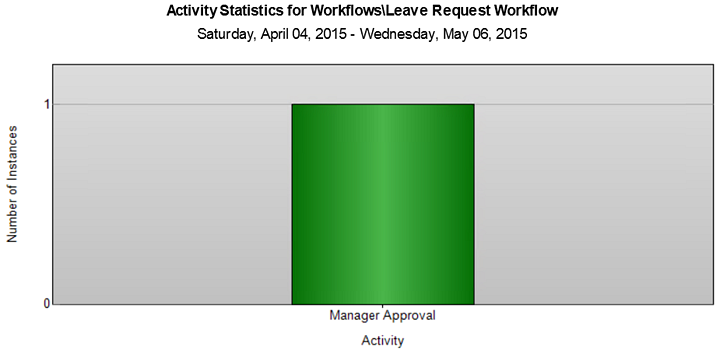
In the chart returned, we see there is one Process Instance running that is older than two days. (Your results may not be the same.) Notice that in this report, we do not see any system tasks. This is because we selected the option to Exclude Server Events.
STEP 2 REVIEW
The Activity Statistics report is very useful for displaying duration-related statistics on individual Activities (events or steps). Use this report to show bottlenecks (which tasks are taking longer than others) or are running longer than desired. You can also use this report to show the number of instances that have been processed in a given time period (for example, how many Leave Request tasks were completed this week).
One of the most-widely used reports, the Process Overview Report allows you to view the details of events (or steps) in a Process Instance. The Process Overview Report initially displays a high-level view of a each Process Instance (Folio, Originator, Status, Start and Finish Dates and Duration) of the selected Process. Within the Process Overview report, you can drill down into each Activity Instance to determine the exact path each step took, and even the audit trail for each. You can also choose to view the report content via the View Flow option, which displays the information in a flowchart format and is almost real-time. (We will cover the View Flow report in the next Part.) This report displays in a spreadsheet or table format.
Step 3 Tasks
- Open the Process Overview Report, then the Leave Request Workflow Process.
- Click on any Process Instance that shows a Completed Status. Was this Leave Request approved or not approved? How can you tell this?
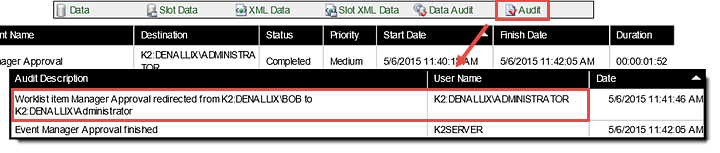
- Access the Audit trail for the Manager Approval step. Check to see if there were any other Process details for this Activity. (In the example below, the Manager Approval task was redirected from Bob to Denallix Administrator.
- Returning to the Process Instances screen for the Leave Request Workflow, Export the data to Excel.
- Review the details for a Process Instance that is still Active. What Activity is the workflow currently on; how long has it been at that Activity?
- In the Reports pane, click on the Process Overview link to open the report.
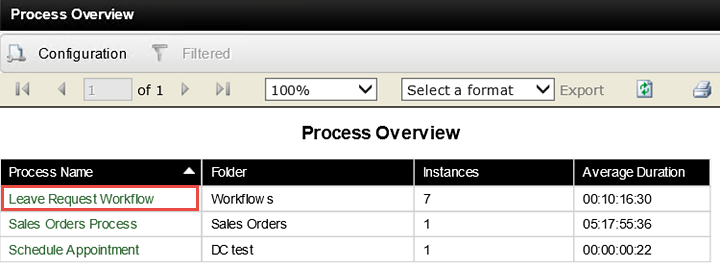
- Click on the Leave Request Workflow Process Name.
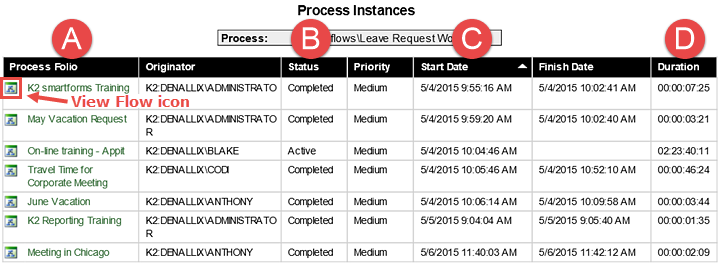
- The Status (B above) column tells us if the Process is still active or has been completed. The Start Date (C above) and Duration (D above) give us an idea of how long this Process has been running, or how long it ran. Notice too, that each Process Instance has a View Flow icon as well.
- Click on a Process Folio name for a Process Instance that has a Completed Status. The Process Overview > Activity Instances screen opens. (Keep a mental note of the Process Instance you are opening. We will want to open the same Process in Part 2: View Flow, so that we can observe the same Process Instance details in a flowchart format.)
- Click on the Manager Approval Activity Name. These are the final details for the Manager Approval step and it shows that Denallix Administrator approved the request.
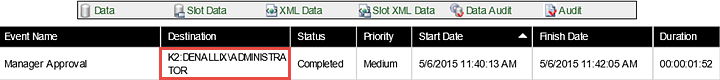
- Click on the Audit link. Now we are looking at the fine details for the Manager Approval step. If there were any deviations from the normal path, they would show up here. And indeed, we can see that the Manager Approval task was redirected from Bob (Anthony's manager) to Denallix Administrator. The User Name column shows us the user that did the task redirection.
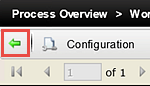
- Use the Previous button to return to the Activity Instances screen.
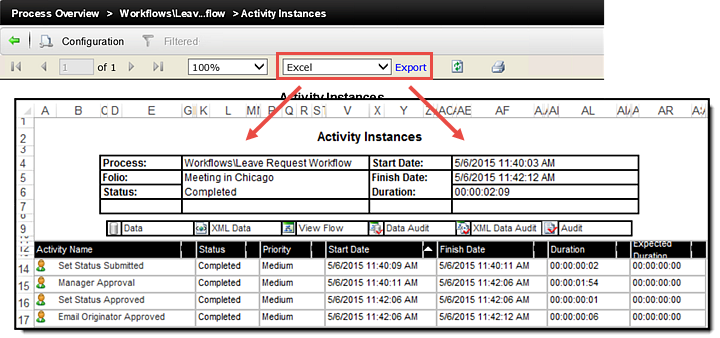
- Select Excel from the Export drop-down options in the tools bar. Click Export. Your report has now been exported to Excel, where you can work with the data as you need to.
- Using the green Previous arrow, make your way back to the Overview Instances landing page. (This is the page that lists all of the Process Instances for the Leave Request Workflow Process.) Click on any Process Instance that shows an Active Status.
On the Report's landing page, you will see a list of all the Processes that have been deployed. This list indicates the number of Instances for each Process, including Active and Completed Instances. You can also see an Average Duration for the Process.
The Process Overview > Process Instances screen opens. This is a list of all Leave Request Workflows that have been submitted. In the image below, notice the Process Folio column. (A below) Recall that we assigned the Leave Request Title as the Folio that helps provide a unique identifier (along with the Originator name) for each Process Instance.
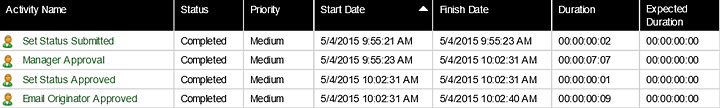
Notice the Activity Name column. Recall building the workflow. These are the events put in place for completing the workflow if the manager Approved the request. We know this request was approved because of the Set Status Approved activity shown. If the request had been rejected, the activity would be the Set Status Rejected. You can view when each step began and ended and the time it took to complete that step.
We know that Anthony was the form originator (for this example). But we also know that Denallix Administrator is not Anthony’s manager. We want to find know why Administrator approved the request and not Anthony's manager. One way to do this is to review the Audit trail for this step.
One last feature to mention that is very useful is the ability to Export reports into Excel or as a PDF file. If using Excel, this would allow you to compile reports from multiple Processes into one worksheet. It also creates a format that you can easily share with others. Most Standard Reports can be exported to Excel and PDF file formats.
We have just reviewed the details for a Process Instance that has been completed. In the next few steps, we will look at a Process Instance that is still Active. This will tell us what event or step the workflow is currently on, and how long it's been there.
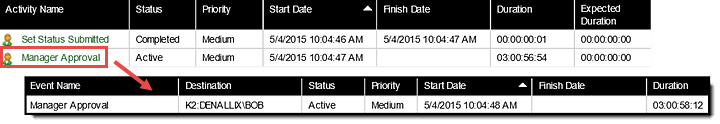
In the Process Instance we selected, we can see that the first system task (Set Status Submitted) has completed. The next task, Manager Approval, is still waiting to be actioned. If we click on the Manager Approval title to view the details, we can see that Bob is the Destination user and the Duration is in excess of 3 days.
STEP 3 REVIEW
In this step, we explored the Process Overview Report and learned how we can drill down into Process Instances and Activity Instances to get a very complete picture of the workflow and its status. The Process Overview landing page gives a high-level view of each Process Instance, displaying the current Status (Active, Completed in our example), the Starting date and Finish date (if Completed) and the Duration. With this report, we are able to drill down into the Activity Instances to view the status of each event, or step, within the workflow Process. Using the Audit feature, we can determine if any additional steps occurred, such as a task being redirected.
Viewing an Active Process Instance shows us the current event or step for the Process.
We can also export report content to Excel or as a PDF file, for distribution or for further compiling report data.
The User Performance Report shows either the number of instances or the duration for a single Activity Instance of a Process, per user. This report can be useful for determining work load or training needs, if a user consistently takes longer to complete the same task compared to other users. An example might be a Help Desk scenario, where requests are submitted by users, and assigned to a group of Help Desk staff. This report would tell you who is responding to the most requests, or who is taking a longer than expected time to resolve requests. This report displays in a graphical format.
Step 4 Tasks
In this step, we want to generate two versions of the User Performance Report.
- The first report will display how long (on average) it takes users to complete the Manager Approval task.
- The second report should display the number of Manager Approval tasks each user has completed within a week's time frame.
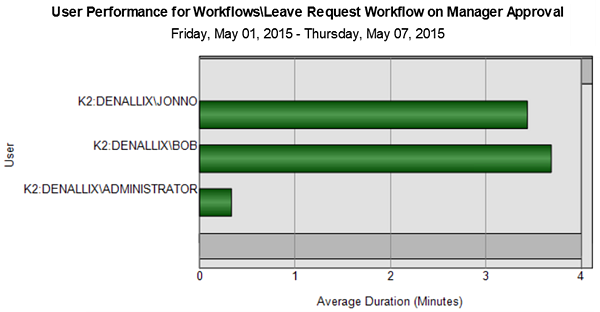
For our first report, we want to see how long (on average) it takes our users to complete the Manager Approval task.
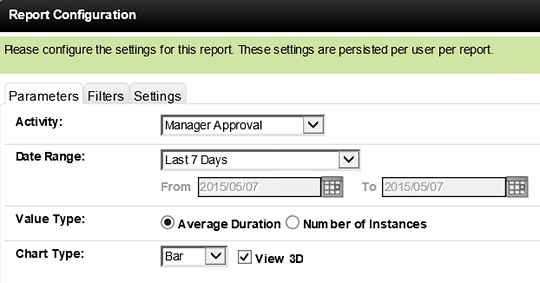
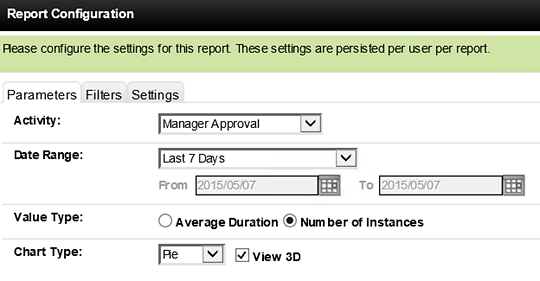
- Click on the User Performance Report. On the landing page, click the Leave Request Workflow Process. The default chart opens. Open the Report Configuration editor and make the following settings:
- Activity: Manager Approval
- Date Range: Last 7 Days (or any range that would contain completed Processes)
- Value Type: Average Duration
- Chart Type: Bar (or any chart type you prefer)
- Workload consistency between users
- Acceptable completion times versus unacceptable completion times (is there a standard?)
- User training for completing the task
- Escalations (reminders, redirection, etc.) for the task
- Once again, open the Report Configuration editor. Change the Value Type to Number of Instances. For this chart, we are going to use a Pie Chart Type, in 3D format.
- Why is one user completing more tasks than the others? Is this a performance issue or a training issue? Do the other users have workloads that are preventing them from taking ownership of tasks?
After the report is generated, we can see a comparison of the Manager Approval task average times for three users. Points we might consider are:
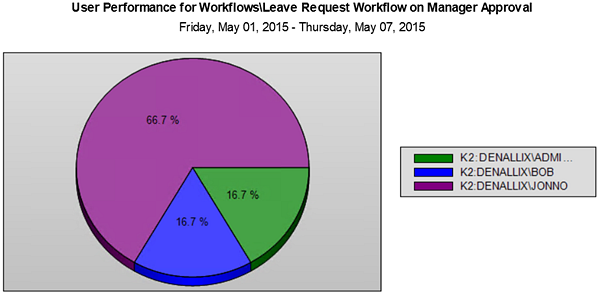
For the next report, we want to see how the workload is spread out among the three users. This report will tell us the number of Manager Approval tasks each user has completed within a given time frame.
The report is generated and we can view the distribution of Manager Approval tasks for our three users. Let's consider chart below using the Help Desk scenario where requests are assigned to a group of Help Desk staff, who in turn take ownership of tasks and complete them. Now we might want to consider:
STEP 4 REVIEW
The User Performance report gives us an overview of task assignments and user volume performance. In the real world, this report would be a starting point for analyzing a number of workplace factors including workload, training (knowledge), performance, time management, etc.
This concludes Part 1: K2 Workspace. When you are ready, continue on to Part 2: View Flow, working with the View Flow Report.