Custom Reports in K2
In the Custom Reports tutorials, we will look at custom reports that are created with K2 tooling and third-party tools. Both report artifacts use SmartObjects as their primary data source. Standard Reports leverage the properties, methods and associations of Workflow Reporting SmartObjects for reporting content. Custom reports can use these SmartObjects as well, but in addition they can also leverage other SmartObjects, allowing you to build custom reports against almost any SmartObject. This allows you to build custom reports that span business data and even more advanced reports that combine workflow reporting data with business data.
In the first tutorial we will use the SmartObject Tester to explore the Workflow Reporting SmartObjects that provide the bulk of reporting properties. We will observe how some reporting SmartObjects have associations with others, thus forming a join type of relationship. In the second tutorial we will create a custom report using the Report Designer found in K2 Workspace, again using Workflow Reporting SmartObject properties for our report content. In the third tutorial, we will use Microsoft Excel to create a report using a data feed to create a PowerPivot table and PivotChart.
Custom Reports
Custom Reports allow more flexibility from what you will find with Standard Reports. Custom reports allow you to select the SmartObject properties you want to display along with related information from other SmartObjects. As with Standard Reports you can filter reporting content, but with custom reports you have more options for filtering. You can also apply (minor) styling to the report format.
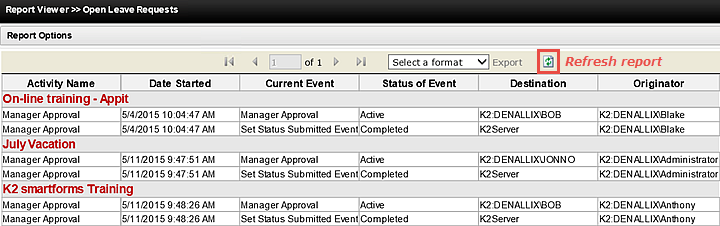
Internal Custom Report created with K2's Report Designer
You can also use third-party reporting tools to create custom report in K2. Typical tools include SQL Server Reporting Services (SSRS), Visio and Microsoft Excel. While we won't go into the details of various custom reporting tools in these tutorials, we will show how to consume a data feed provided by K2 in a Microsoft Excel document and then create a PivotChart from that data. The main difference in the third-party reporting tool is what format of data retrieval it supports: some provides (like SSRS) need to use a component called the ADO.NET provider to retrieve data from K2, while others like Microsoft Excel would use a Web Service to retrieve the data.
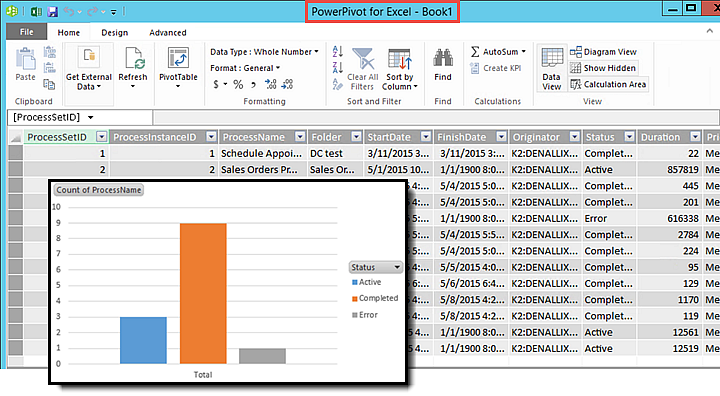
External Report created in Excel using a Data Feed
Getting Started
When you are ready to begin the Custom Reports tutorials, continue on to the first section Reporting SmartObjects to get started.