Part 5: Reports
K2 offers a number of technologies for reporting on and administering workflows. In previous user guides, you have explored the capabilities of K2 Workspace for administering workflows and providing very detailed reports on process/activity instances. (Refer to the Reporting in K2 tutorial for expanded reporting instructions.)
In the next section you will work solely with K2 Designer and create a new view that contains Reporting controls. You will then add that view to a new form and configure rules to call the Reporting chart data when the form is loaded.
Dashboard-style reporting controls are found in K2 Designer (only) and are available to use on any view as needed. These controls include charts and grids and can be configured to provide real-time feedback.
In this part, you will learn:
- How to add and configure reporting controls on a view
- How to configure the rules for a form containing a Report view
If you have not completed Part 4: Workflows of this tutorial yet, please do so now since you will be using the submitted data (that your testing produced) as content for your Reports.
For instances where you want to create more of a dashboard type of report, K2 Designer has a number of controls that can easily be implemented on a new form/view or even as a web part in SharePoint. For this exercise, you will explore Reporting controls found in K2 Designer.
Step 20 Tasks
- Create a New View from the
views category and Name it
Sales Orders Reports
and confirm the Item View option is highlighted. - Configure the layout table for 1 Column and 2 Rows. Add a Workflow Duration Chart control into the first table row and an Activity Instances Chart into the second table row.
- Make the following configuration changes in the Properties pane for the Workflow Duration Chart:
- Make the following configuration changes in the Properties pane for the Activity Instances Chart:
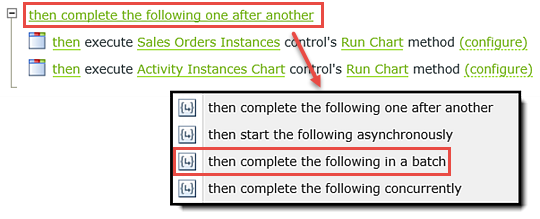
- Edit the view’s When the View executed Initialize rule and add two new Actions to Execute a control’s method as indicated in the image below. Change the Actions to run in a batch. (There are no other configurations necessary.)
- Create a New Form from the Forms category and Name
Sales Orders Dashboard
then change the form’s Width to
60%
and add the Sales Orders Reports view to the canvas. - Run the Sales Orders Dashboard form to confirm the charts are being populated with workflow data.
| Name | Value |
|---|---|
| Name | Sales Orders Instances |
| Title | Sales Orders Submitted |
| Workflow Names | Sales Orders Process |
| Range | This Week |
| Group By | Daily |
| Display Value | Instance Count |
| Name | Value |
|---|---|
| Name | Activity Instances Chart |
| Title | Workflow Status |
| Workflow Names | Sales Orders Process |
| Range | This Week |
| Display Value | Instance Count |
- In K2 Designer, right-click the Views
category and select New View. Click Next on the
view home screen. Name the view
Sales Orders Reports
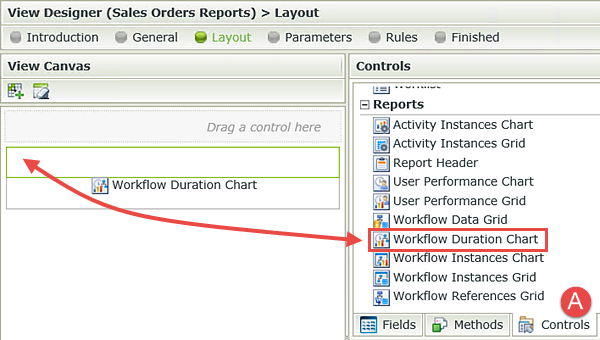
and confirm the Item View option is highlighted. Click Next. - Select the Create Layout Table only. Set the table layout for 1 Column and 2 Rows. Click on the Controls tab and drag a Workflow Duration Chart found under the Reports heading, into the first table row.
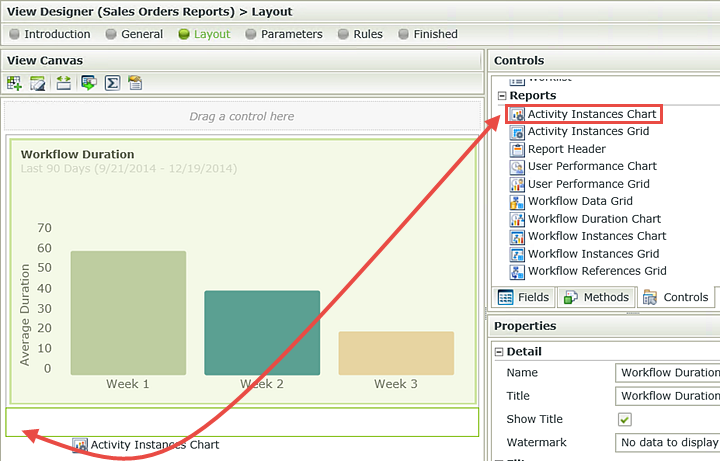
- Drag an Activity Instances Chart into the second table row.
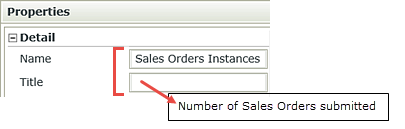
- Click on the Workflow Duration Chart to highlight it. In the Properties pane, change the Name to
Sales Orders Instances
and the Title to
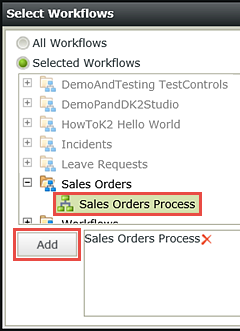
Number of Sales Orders submitted - In the Properties pane, under Filters, open the Select Workflows editor for the Workflow Names field. Add the Sales Orders Process workflow. In this step, you are telling K2 to retrieve the statistics for the Sales Orders Process workflow. If you were creating a broader-based chart, you could add additional workflows as well.
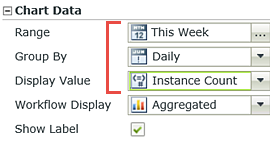
- Under the Chart Data heading, change the Range to This Week, the Group By value to Daily and the Display Value to Instance Count.
- Make the following configuration changes to the Activity Instances chart:
- Name: Activity Instances Chart
- Title: Workflow Status
- Workflow Names: Add the Sales Orders Workflow
- Range: This Week
- Display Value: Instance Count
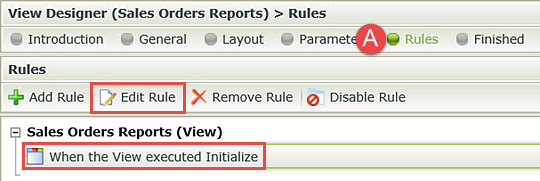
- Click on the Rules tab located in the Breadcrumb Bar. Highlight When the View executed Initialize and click Edit Rule.
- Click on the Actions tab, then search for
execute a control
then click the Action, Execute a control’s method, to add it to the rule definition pane. - Click the select control link and select Sales Orders Instances. Click the select method link and select Run Chart.
- Add another Execute a control’s method to the rule definition pane and select Activity Instances Chart for the control and Run Chart for the method.
- Change the Actions to run as a batch.
- Right-click the Forms
category and select New Form. Click Next on the
forms home screen. Name the form
Sales Orders Dashboard
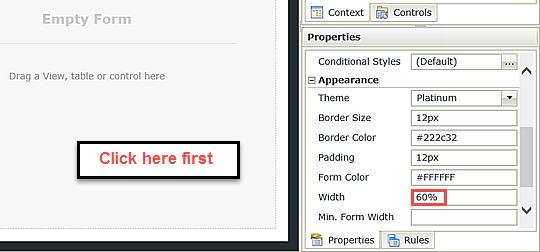
and click Next. - Click anywhere within the
form canvas and change the Width to
60%
in the Properties pane. - Drag the Sales
Orders Reports view into the form canvas. Change the View Title to
Sales Orders Reports
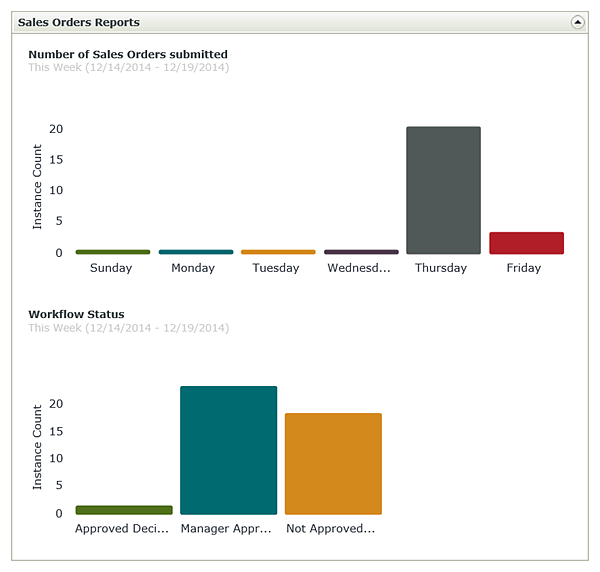
then click Finish and Check In the form. Run the form to check out the drop & drag Reporting capabilities of K2 Designer! (Your results won’t be exactly as shown.) If time allows, submit a few more Sales Orders forms then Run the Reports view once again to see the charts update in real-time.
This completes the configuration for the Sales Orders Instances chart. Using almost the same steps, you’ll configure the settings for the Activity Instances chart.
The last step for your chart view is to configure two Actions that will populate the charts when the view loads.
Click OK and then Finish to complete the chart and view configurations. Check In the Reports view.
In the next step, you will create a form for the Sales Orders Reports view. This will allow the reports to be exposed to external sources and users.
STEP 20 REVIEW
In this last step for building your Sales Orders application, you created a mini-dashboard in K2 Designer using built-in reporting controls. While workflow administration would likely take place in K2 Workspace, there are a number of powerful controls that can be implemented with drop & drag methods. The ability to configure multiple charts in a single view makes creating summary dashboards quick and highly flexible. If you are in a SharePoint environment with K2 enabled, you can add a K2 Web Form web part to display this form directly on a SharePoint page.
This concludes Part 5: Reports. In Part 6: Debugging SmartForms, you will learn how to add a query string to the Runtime URL of your SmartForm to expose debugging logs.