Part 6: Debugging SmartForms
In this section, you will demonstrate one method for manually debugging SmartForms. This section does not cover in-depth troubleshooting of K2 logs and workflows, however. To view K2's real-time debugging logs for SmartForms, you will append a query string to the end of the form's Runtime URL, then run the form. The query string has five levels, with first level (1) returning the most information and the fifth level (5) returning errors only.
In this exercise, you will append a query string to the form’s Runtime URL and then view the debugging logs generated.
Step 21 Tasks
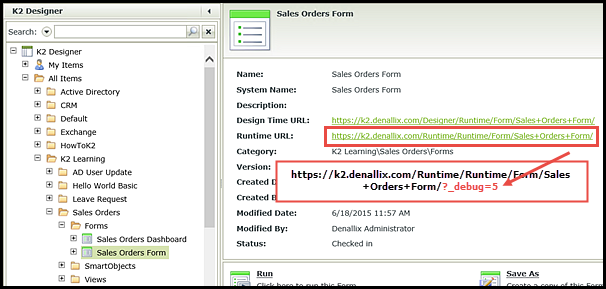
- Launch the Sales Orders Form using the Runtime URL found in the Properties pane. Append
?_debug=5
to the end of the URL and click Enter to re-run the form. - Review the debugging logs. Review the additional Data logs for those line items that indicate additional data available.
- Exit the Debugging Data log, then Clear and Exit the Debugging Inforamtion log.
- Change the debug level to
?_debug=1
and review the logs to see the additional information now available.
- Highlight the Sales Orders Form and click the Runtime URL found in the Properties pane. In the browser window, append
?_debug=5
to the end of the URL string and click ENTER to launch the form in debug mode. - Debug: Returns the most information, similar to a tracing log.
- Message
- Info
- Warning
- Error: Returns the least amount of information, just errors.
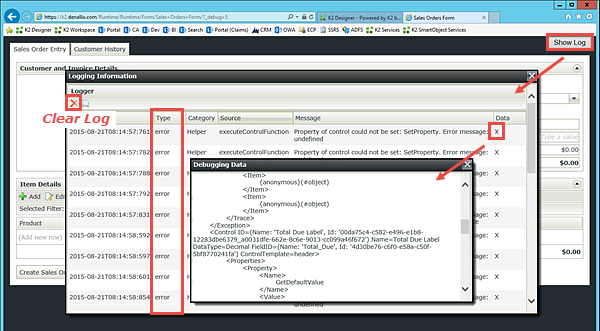
- You should now see a Show Log button in the upper right corner of your screen. Click the Show Log button and review the log output that appears in a pop-up screen. Notice the Type column indicates only error.
- Notice in the far-right (Data) column some line items show an 'X'. This indicates that additional logging information is available. Double-click a line-item that indicates additional data. Review the information contained in the new pop-up.
- Exit the Debugging Data pop-up, then Clear the Logging Information log. Exit the log.
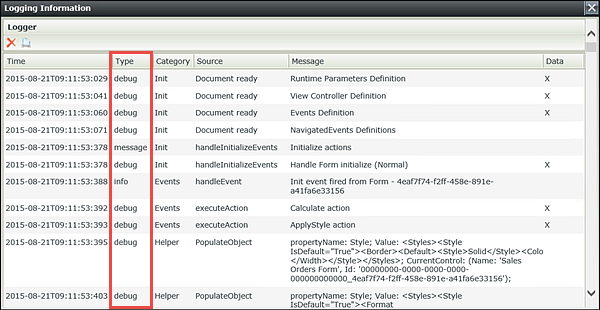
- Change the debug level in your query string to
?_debug=1
and click ENTER. Notice the additional information that is now available. You now see additional debug Types listed.

There are five levels of debugging available using the query string method. Level 1 provides the most information and Level 5, the least amount of information.


STEP 21 REVIEW
In this section you learned that by appending a debug query string to your form's URL, you can load the form in debug mode. The debug mode loads in real-time. By changing the debug level, you can control how much information is output. Where indicated, you can review additional data. Clearing the logs is also helpful in keeping the debugging process neat and concise.
This concludes Part 6: Debugging SmartForms. In your final section, Part 7: Package and Deploy, you will learn how to package your K2 artifacts so that they can be deployed to another environment.