Query using Microsoft Power BI Desktop
You can use Microsoft Power BI Desktop to access data from the Reporting API and create custom reports.
Connect to the Reporting API
Note: You must complete these steps the first time you use a Microsoft Power BI Desktop file to connect to the Reporting API. Ensure you have the API Key. For more information, see Create API Key.
- Open a new file in Microsoft Power BI Desktop.
- Click Get Data > OData feed.
- In the OData feed dialog box, type the URL for your region in the URL field.
Based on your region, use one of the following URLs to connect to the Reporting API.
Region
Reporting API URL
Australia https://au-reporting.promapp.io/odata United States
https://us-reporting.promapp.io/odata
Europe
https://eu-reporting.promapp.io/odata
Canada
https://ca-reporting.promapp.io/odata
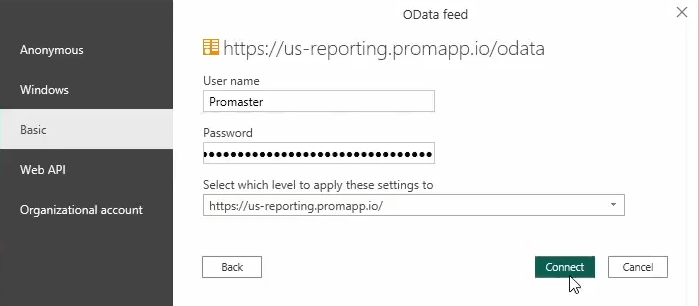
UAE https://ae-reporting.promapp.io/odata - Click OK.
-
From the Authentication options select Basic.
-
Specify Promaster as the User name.
-
Copy and paste the API Key as the Password.
-
Click Connect
In some configurations you can't use Basic authentication, such as when using multiple tenants. For these configurations you must use bearer tokens, as shown below:
Note: You must complete these steps the first time you use a Microsoft Power BI Desktop file to connect to the Reporting API. Ensure you have the API Key. For more information, see Create API Key.
- Open a new file in Microsoft Power BI Desktop.
- Click Get Data > OData feed.
- In the OData feed dialog box, type the URL for your region in the URL field.
Note: The first time you use the URL with bearer token authentication you must add '/discover' at the end - e.g. https://<region>-reporting.promapp.io/odata/discover. This allows the wizard to continue as the bearer token content is added in a Power Query in a later step.
Based on your region, use one of the following URLs to connect to the Reporting API.
Region
Reporting API URL
Australia https://au-reporting.promapp.io/odata United States
https://us-reporting.promapp.io/odata
Europe
https://eu-reporting.promapp.io/odata
Canada
https://ca-reporting.promapp.io/odata
UAE https://ae-reporting.promapp.io/odata - Click OK.
- Click Transform Data
-
The Power Query Editor window is displayed.
Note: If you get a connection error, click File > Options and Settings > Options > Data Load > Clear Cache.
- In the Power Query Editor window, under the Home tab, click Manage Parameters > New Parameter.
- In the Name field, type API Key.
- Type Promapp Reporting API Key in the Description field.
- Ensure the Required check box is selected.
- From the Type drop-down list, select Text.
- In the Current Value field, enter the API token value you have copied as described in the topic: Create API token.
- Click OK.
- On the left pane, click Query.
- In the Home tab, click Advanced Editor.
- In the Advanced Editor window, copy and paste the following:
- Click Done.
The list of tables for the supported endpoints is displayed. For more information about the endpoints, see API Reference.
- To exit the Power Query editor and load data in the file, click Close & Apply.
let
AccessTokenHeader = "Bearer " & #"API Key",
Headers = [Authorization=AccessTokenHeader],
Source = OData.Feed("<Reporting API URL>", Headers)in
Source
You can save the file with the configured values and use the Power Query Editor to customize data and create reports.
Create a report
After you have connected to the Reporting API Odata feed, you can use the Microsoft Power BI file to create custom reports.
- Open the file in Microsoft Power BI Desktop.
- Click Edit Queries > Edit Queries.
- In the Power Query Editor window, the list of tables for the supported endpoints is displayed. For more information about the endpoints, see API Reference.
Note: The Discover table is only a placeholder for OData feed validation and this link will not display any data.
- In the Data column, click on the Table link to display data for the corresponding table. The table fields are displayed with the corresponding data in rows. For more information about the columns, see the Properties tables in API Reference.
- To select a different table:
- Click View > Query Settings.
- On the right pane, click Query Settings > Source to display the list of available tables.
- To refresh data, click Refresh Preview > Refresh All. The data is not refreshed in real-time and it can take up to 8 hours to fetch the updated details.
You can use the Power Query Editor to customize data and create reports. For more information, see the Microsoft Power BI documentation.