Query using Microsoft Excel
The blank Microsoft Excel templates below will help you get started and easily access data from the Reporting API.
You can download the templates and create reports to track the required metrics.
Note: Ensure you have the API Key. For more information, see Create API Key.
Download blank templates
Blank Microsoft Excel template for Improvements Add-on data
Blank Microsoft Excel template for process health data
Note: We recommend using Microsoft Excel for Office 365. This template cannot be used with older versions of Microsoft Excel, it can only be used with versions that support PowerQuery and the xlsx file format.
Create your first query
You must complete these steps the first time you use the Microsoft Excel file to connect to the Reporting API.
- Open the template and if prompted, click Enable Editing, and then click Enable Content.
The list of available tables from which you can retrieve data is displayed.
- Click Data > Get Data > Launch Power Query Editor.
The instruction above is for Microsoft Excel for Office 365. Follow an instruction below if you’re using a different version of Microsoft Excel:
2019: Click Data > Queries & Connections.
2016: Click Data > New Query > Combine Queries > Launch Query Editor.
2013/2010: Click Power Query > Launch Editor.
- On the left pane, click API Key and paste the value you have copied as described in the Create API token topic.
- On the left pane, click Reporting API URL.
- From the Current Value drop-down list, select the URL.
Based on your region, use one of the following URLs to connect to the Reporting API.
Region
Reporting API URL
Australia https://au-reporting.promapp.io/odata United States
https://us-reporting.promapp.io/odata
Europe
https://eu-reporting.promapp.io/odata
Canada
https://ca-reporting.promapp.io/odata
UAE https://ae-reporting.promapp.io/odata
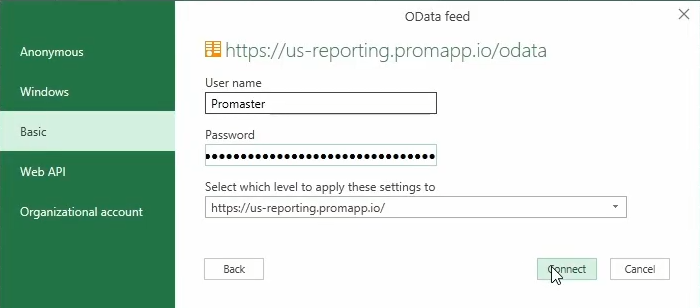
- On the left pane, click Reporting API OData. If prompted, click Edit Credentials and then click Connect. The list of tables for the supported endpoints is displayed. For more information about the endpoints, see the API Reference section.
- To view table data, for example, the Processes table, in the Data column and the Processes row, right-click Table > Add as New Query. The Processes table data is displayed. For more information about columns, see the Properties tables in the API Reference section.
- To fetch and display data for the remaining tables, in the Query Settings column, click Source and repeat Step 7.
-
Click Close & Load > Close & Load.
- Click Data > Refresh All > Refresh All. The Microsoft Excel file displays a new worksheet for each query you add.
- Click Save.
Note: If data is not displayed, click Data > Refresh All > Refresh All again.
You can now use this file to configure relationships, add PivotTables, and explore other Microsoft Excel options to customize and create the required reports like the Improvements Add-on examples below.