Blank template: Microsoft Excel O365
Follow these steps if you are using Microsoft Excel O365.
Before you beginEnsure you have the API Key. For more information, see Create API Key.
Authenticate and connect to the Nintex Process Manager Reporting API
- Open the template and if prompted, click Enable Editing and then click Enable Content. The list of available tables from which you can retrieve data will be displayed.
- Click Data > Get Data > Power Query Editor.
- On the left pane, click API Key and paste the value you have copied as described in the Create API token topic.
- On the left pane, click Reporting API URL.
- From the Current Value drop-down list, select https://au-reporting.promapp.io/odata.
Note: Only the https://au-reporting.promapp.io/odata URL is currently available.
- On the left pane, click Reporting API OData. If prompted, click Edit Credentials and then click Connect. The list of tables for the supported endpoints will be displayed. For more information about the endpoints, see API Reference.
To exit the Power Query editor and load data in the Microsoft Excel file, click Close & Load.
- Click Data > Refresh All.
You can save the file with the configured values and use the Power Query Editor and PivotTable in Microsoft Excel to customize data and create reports. For more information, see Example: Configure and create reports.
Example: Configuring the Microsoft Excel file
This section describes an example of how you can configure the Microsoft Excel file in order to display data and relationships to help you create the required reports.
- Open the template and if prompted, click Enable Editing and then click Enable Content.
- Click Data > Get Data > Power Query Editor.
- In the Power Query Editor window, the list of tables for the supported endpoints will be displayed. For more information about the endpoints, see API Reference.
- In the Queries column, right-click Reporting API OData > Rename, and type Incidents.
- In the tables list, click the Table link for the Incident table row. If prompted, click Continue. The Incident table data will be displayed.
- In the Queries column, right-click on Incidents and then click Duplicate.
- Right-click on the duplicated query, then click Rename, and type IncidentFields.
- In the Query Settings column, click Source.
- In the tables list, click the Table link for the IncidentField table row. If prompted, click Continue. The IncidentField table data will be displayed.
Note: This example describes the Incident and IncidentField table. You can use the same steps for the other tables. In the Data column, click on the Table link to display data for the corresponding table. The table fields will be displayed with the corresponding data in rows. For more information about the columns displayed, see the Properties tables in API Reference.
- To select a different table:
- Click View > Query Settings.
- On the right pane, click Query Settings > Source to display the list of available tables.
- To refresh data, click Refresh Preview > Refresh All. The data is not refreshed in real-time and it can take up to 8 hours to fetch the updated details.
- Click Close & Load > Close & Load.
- Click Data > Refresh All > Refresh All. The Microsoft Excel file will display two new worksheets for the Incidents and IncidentFields details.
Note: If data is not displayed, click Data > Refresh All > Refresh All again.
You can configure relationships, add PivotTables, and explore other Microsoft Excel options to customize the data displayed and create the required reports. The following section describes an example report.
Example: Reporting by Portfolio Name
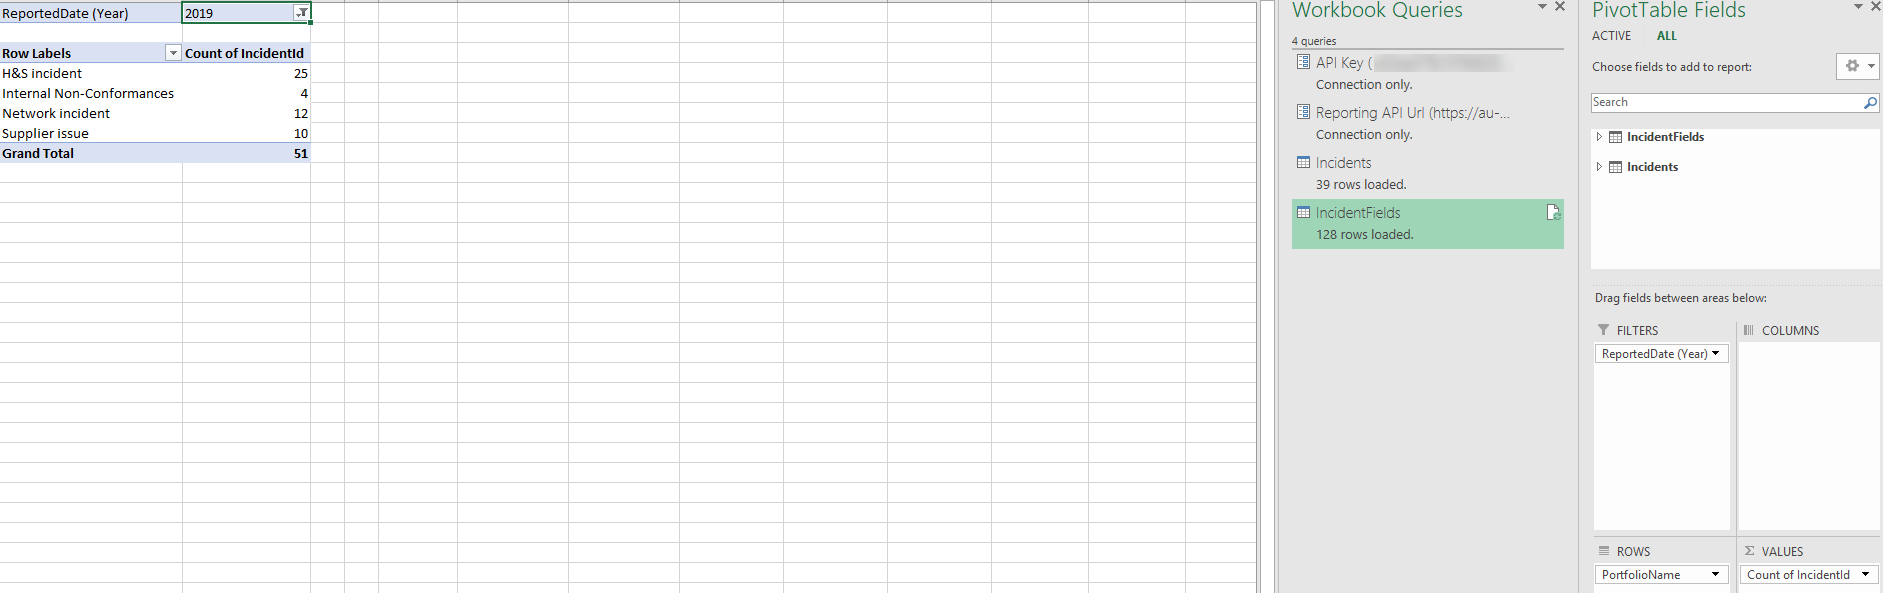
This section describes an example of how you can configure the relationships between the Incident and IncidentField table data and add a PivotTable to create a report to display the total number of incidents created for each portfolio in 2019.
- Complete step 1 to step 10 described in Example: Configuring the Microsoft Excel file.
- From the Workbook Queries column displayed on the right, click the query name to load the corresponding sheets and rename as Incidents and IncidentFields for clarity.
- Click Incidents and then click Data > Relationships.
- In the Manage Relationships dialog, click New.
- In the Create Relationship dialog, select the following values:
- Table: IncidentFields
- Related Table: Incidents
- Column (foreign): IncidentId
- Related column (Primary): EntityId
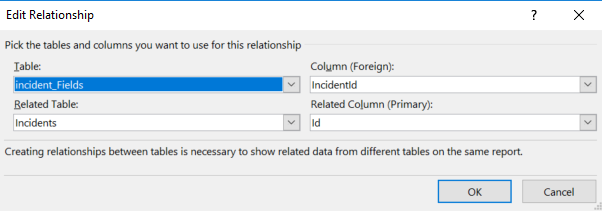
- Click OK > Close.
- Click Insert > PivotTable.
- In the Create PivotTable dialog, select the following values:
- Select the Use this workbook's Data Model check box.
- Choose where you want the PivotTable report to be placed: New Worksheet.
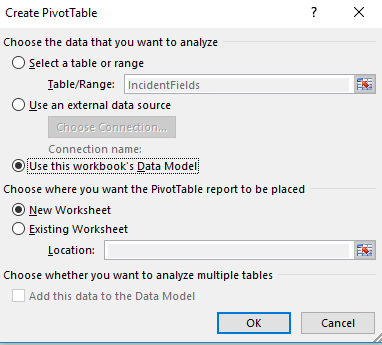
- Click OK. The new worksheet will be displayed with the PivotTable. The Workbook Queries and PivotTable Fields columns will be displayed on the right.
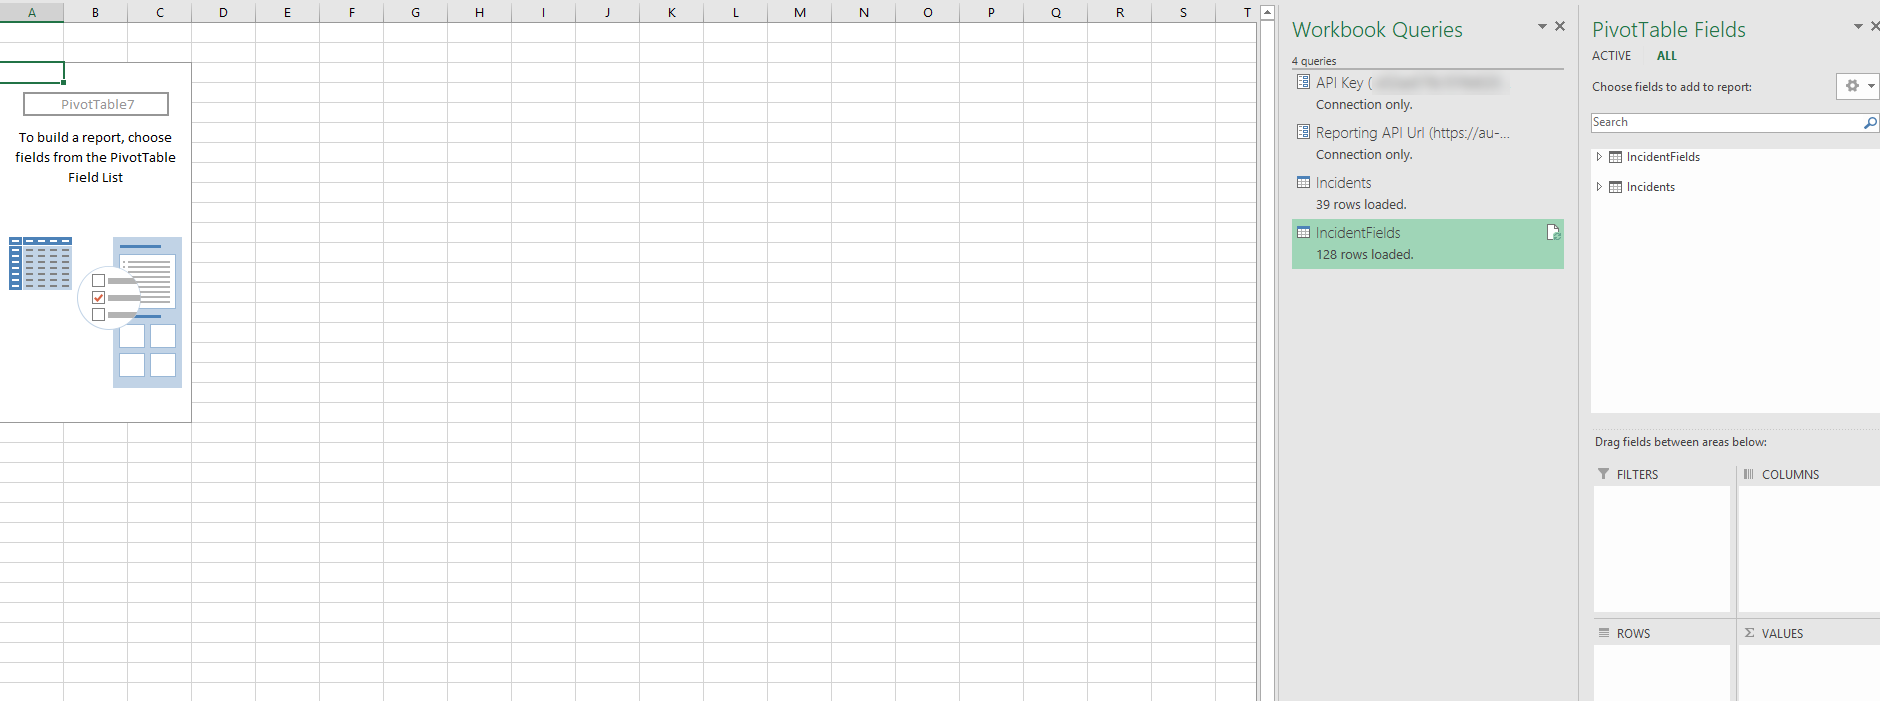
- In the PivotTable Fields column, drag and drop the fields as follows:
- IncidentFields > IncidentId to VALUES
- Incidents > PortfolioName to ROWS
- Incidents > ReportedDate to COLUMNS. The ReportedDate, ReportedDate (Year), ReportedDate (Month), and ReportedDate (Quarter) columns will be added.
- Click on the ReportedDate, ReportedDate (Month), and ReportedDate (Quarter) columns and then click Remove Field.
- Drag and drop the ReportedDate (Year) column to the FILTERS area.
- For the ReportedDate (Year) filter displayed on the worksheet, select 2019.
The PivotTable will display the total number of incidents for each portfolio for the Year 2019 as illustrated in the following image. You can use the fields to customize it for your requirements. For more information about working with PivotTables, see the Microsoft Excel help center.