SmartForms Reporting Controls
- From Nintex K2 Cloud Update 21 onwards there are two different apps for SharePoint Online. The legacy Nintex K2 Cloud for SharePoint app: used for SharePoint upgraded tenants, and the Nintex K2 Cloud (SPFx) app: used for new tenants.
- Microsoft has announced the deprecation of the SharePoint Add-Ins model for SharePoint Online, effective 2 April 2026. We recommend migrating to Nintex K2 Cloud (SPFx) app using the Nintex K2 Cloud SPFx Migration Tool to avoid potential disruptions.
Create a predefined workflow reports in your solutions. These report controls provide status and statistical data on workflows. Configure the reporting controls in the Designer.
Add the following reporting controls to a view based on what data you want to show and how you want to show it:
- Process graphs: Shows the time or the count of processes in a graph or chart
- Activities (aka workflow steps) graphs: Lists the time or count of the workflow steps within workflows
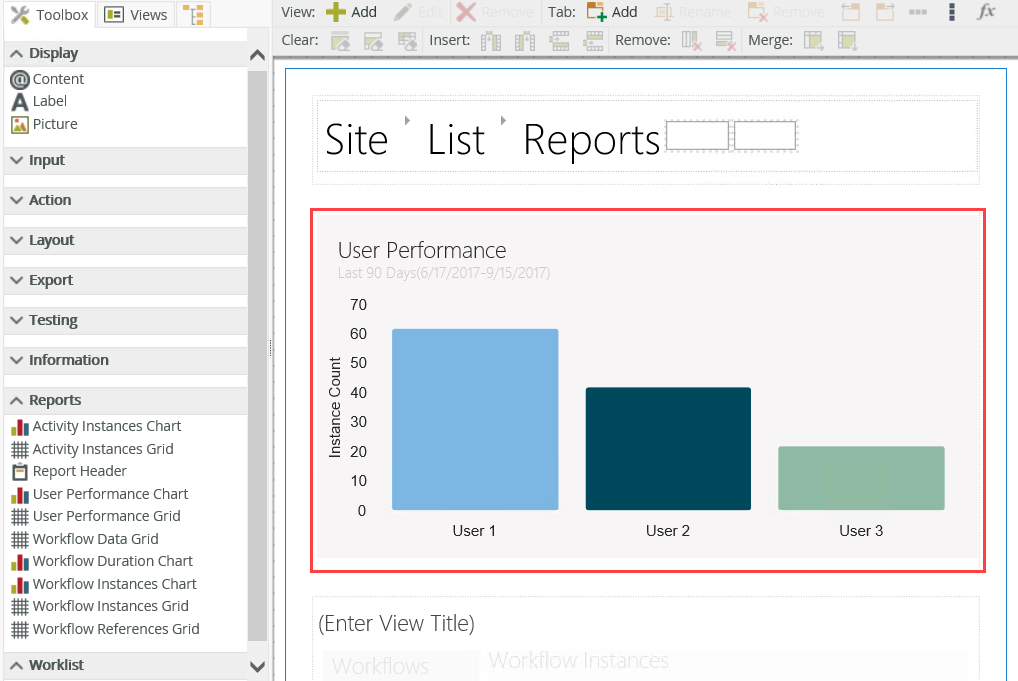
- User performance graphs: Shows the users involved in a specific process or workflow step, the time they took to complete the task, and the decisions they made in the workflow
- Data audit reports: Audit information is workflow data changed by workflow participants. This report shows workflow information and changes made to it.
- Item controls: Allow you to open a form by clicking on an item used or accessed during the workflow. For example, you can open the order processing form from the order process workflow. As another example, you can access the PDF version of a form captured during steps of the workflow
- View Flow: This report provides a graphical representation of a workflow instance. The View Flow report includes actions performed by users during the execution of the process, data changed, and the path the workflow has followed up to the current state
Configure and combine the controls to build reports that work together and respond to events. For example, you can create a rule that loads all the task actions when you click the name of a workflow. Another example is to create a rule that loads the user names, along with their details, of participants of a step in the workflow.
Before adding any controls, make sure you have existing workflow instances. Without any workflow instances, the reports cannot show any data.
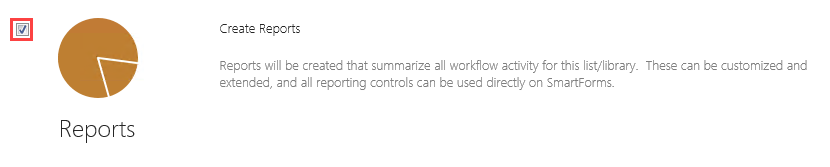
- When integrating your SharePoint list or library with the product, select the Create Reports check box.
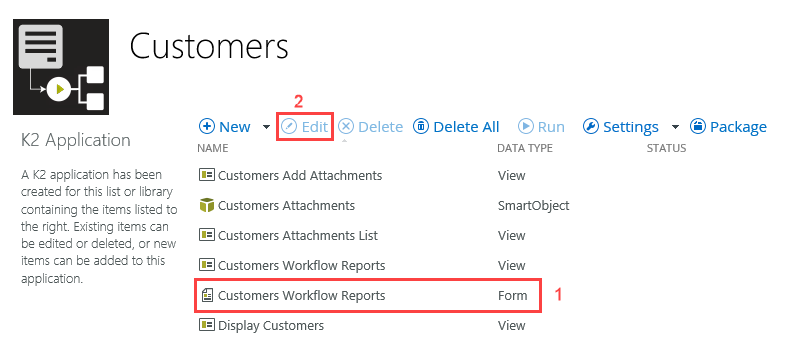
- From your K2 Application, notice that the report form and view is generated. To customize the report, select the report and click Edit.
- the Designer opens with your workflow report.
- From the Toolbox, drag any control from the Reports section onto the canvas. This adds report functionality to a view.
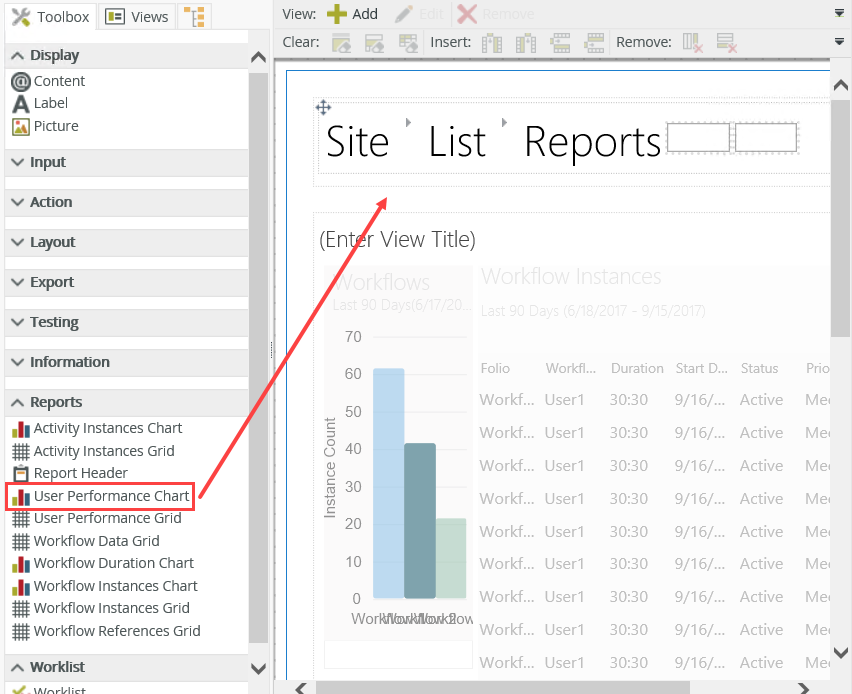
- The new control shows on the view.
- You can add rules to control how the report works. For more information on configuring rules, go to smartforms.
- Click Finish to complete the customization.
For information on running these reports, go to the Using Reports topic.