How to: Use the OData Feed with Microsoft Excel
This article illustrates how to expose SmartObject data through the SmartObject OData API. Using the OData service, you can build custom reports and other interfaces based on SmartObject data. In this demonstration, you display SmartObject content in a Microsoft Excel PivotChart. For a demonstration on exposing data in Microsoft Power BI, see How to: Use the OData Feed with Microsoft Power BI.
Enabling the SmartObject OData API in Management
Scenario
You work in IT where you create custom reports for various departments. One department requires an Excel PivotChart report with data from another LOB system. To meet this need, you enable the SmartObject OData API and configure a connection to it from Excel.
Steps
Begin by creating a SmartBox SmartObject and adding some data. This SmartObject represents the LOB system data you need to expose and can be any SmartObject. Enable the SmartObject OData API service using the Management site. In Excel, configure a connection to the OData service, then create a PivotChart using the exposed data.
Setup Steps
The following steps set up the scenario from start to finish. If you want to skip the setup steps and view the topic step, go to Configure an OData connection in Excel.
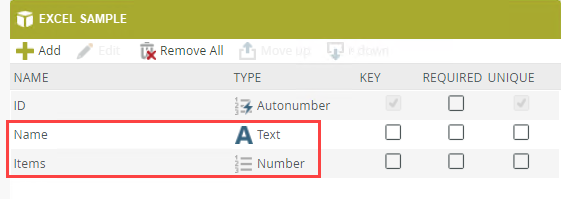
- In the Designer, create a SmartBox SmartObject called Excel Sample with the following properties: Name (Text) and Items (Number). (Optional) Create categories first to keep your work organized. In the Management site, add at least three items in the SmartObject.Using the word OData in your SmartObject name could cause errors when configuring the data feed connection in Excel. Make sure your SmartObject name does not contain OData (upper or lower case).
- Launch the Designer.If you do not know how to access the Designer, see Accessing Sites.
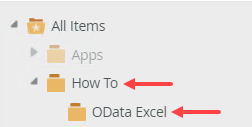
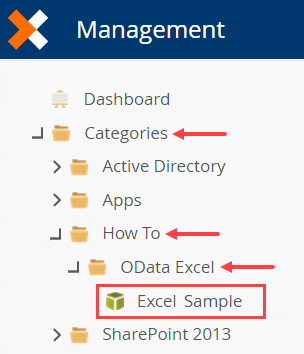
- Create categories to keep your work organized. Use the image below as a guide if necessary.
- From the OData Excel category, create a new SmartBox SmartObject called
Excel Sample
then add two properties
Name (Text) and
Items (Number).Using the word OData in your SmartObject name could cause errors when configuring the data feed connection in Excel. Make sure your SmartObject name does not contain OData (upper or lower case).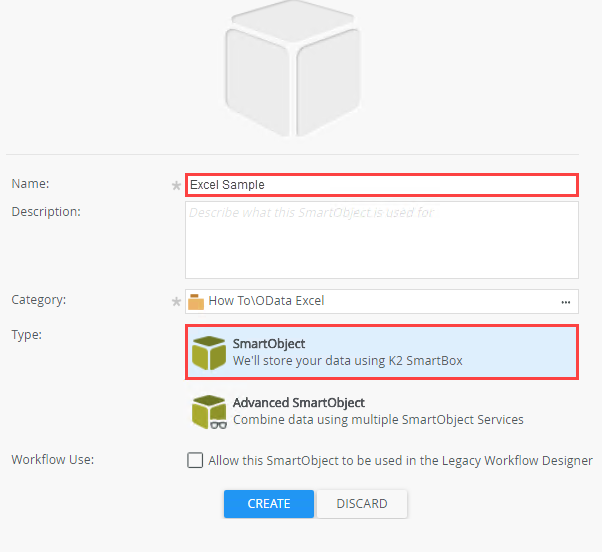
- Next, add items to the SmartObject so that you have data to work with later. Launch the Management site in a new browser tab.
- Expand the Categories > How To > OData Excel categories and select the Excel Sample SmartObject.
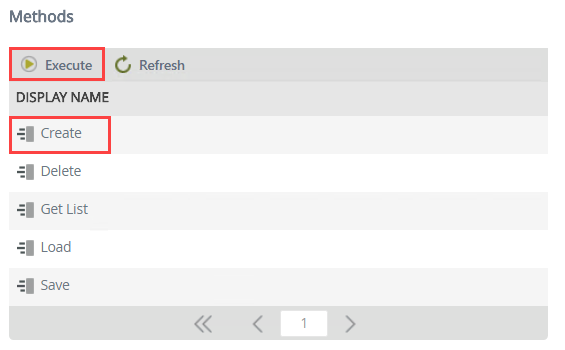
- In the central pane, locate the Methods section. Select the Create method and click Execute.
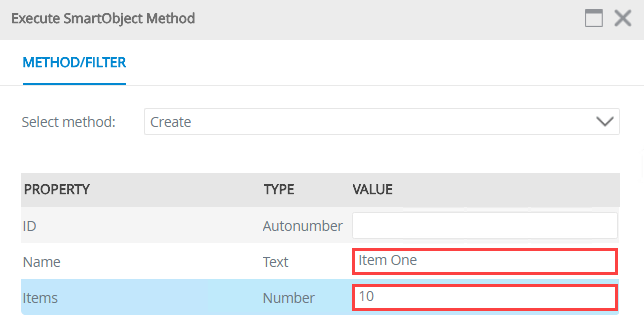
- Enter a Name value and enter a number for the Items value. Click Execute once again. Click Done to exit the Execute SmartObject Method screen.
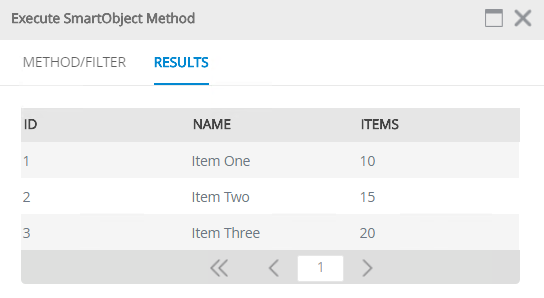
- Create at least two more items in the SmartObject. If you like, execute the Get List method to see your data.
- Launch the Designer.
- Enable the SmartObject OData API service. Select the Excel Sample SmartObject as the only data source. Copy the API URL as you need it when configuring the connection in Excel.
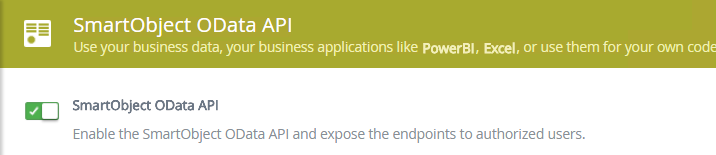
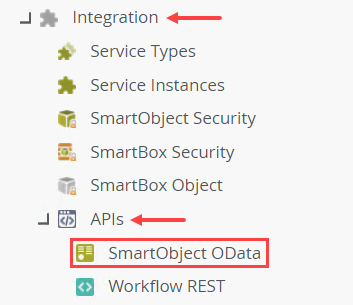
- Still in the Management site, expand the Integration > APIs nodes. Select SmartObject OData.
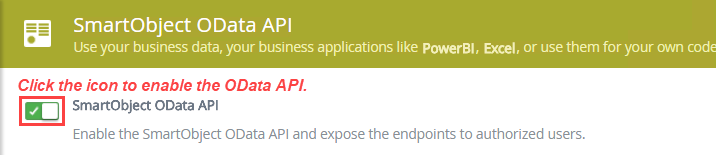
- In the central pane, enable the SmartObject OData API.
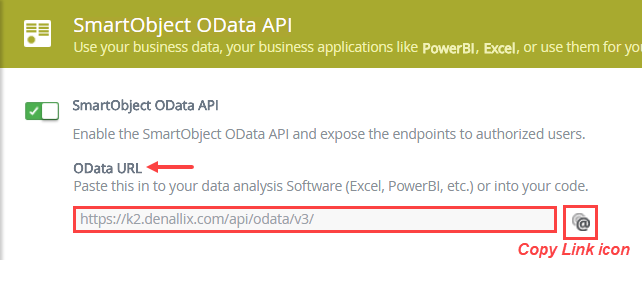
- Copy the OData URL for later use. Click the Copy Link icon. (If necessary, paste the link into an editor such as Notepad. You need it to configure the feed connection in Excel.)
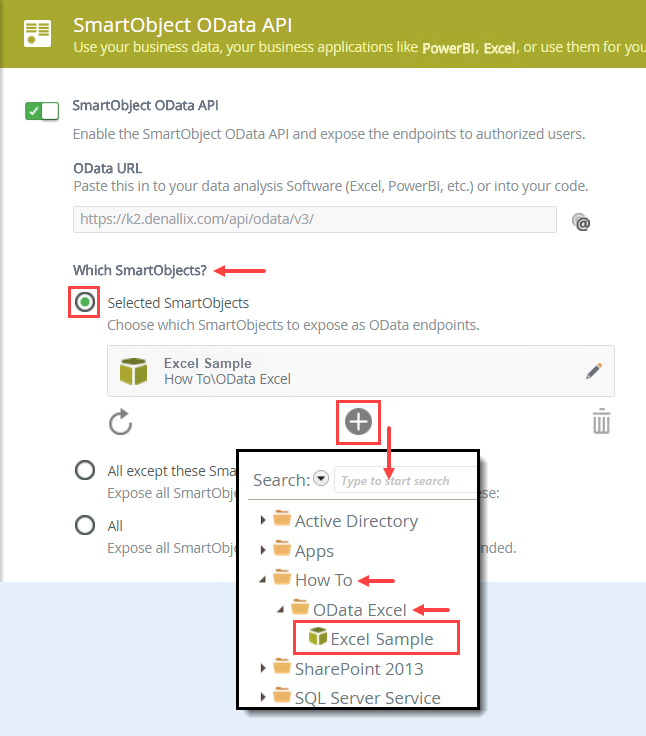
- Next, you must expose the SmartObject as an OData endpoint. Under the Which SmartObjects heading, select the Selected SmartObjects option. Click the Add(+) icon. Navigate to and select the Excel Sample SmartObject. Click Select.
- Click Apply Changes at the bottom of the page. You are now ready to add the connection in Excel.
- Still in the Management site, expand the Integration > APIs nodes. Select SmartObject OData.
Configure an OData connection in Excel
In this step, you configure a connection to the system using the OData Data Feed in Excel. You display this data in a PivotChart.
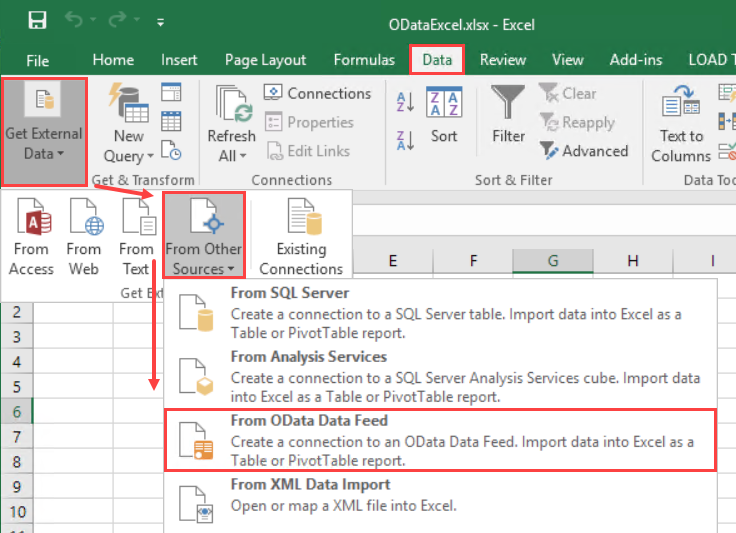
- In Excel, configure an external data source using the settings below.
(Location: Data (tab) > Get External Data > From Other Sources > From OData Data Feed)Property Value Notes Link or File https://k2.denallix.com/api/odata/v3/ This is the API URL you copied earlier. The value displayed is the standard K2 link. Depending on your environment, the link may be different. Log on credentials K2-provided VM:
User Name: Denallix\Administrator
Password: K2pass!Enter the credentials of the administrator that enabled the OData service. This could be yourself or the Administrator account if you are working on a K2-provided VM. Select Tables Excel_Sample Import Data PivotChart PivotChart Fields Name
ItemsAxis (Categories) Name Keep the Name field for the axis category. Values Items Move the Items field into the Values box. - Launch Excel. Create and save a new, blank workbook.
- Select the Data tab. Click Get External Data and From Other Sources. Click From OData Data Feed.
- The Connect to a Data Feed wizard launches. Paste the API URL you copied earlier into the Link or File text box. It should look similar to: https://k2.denallix.com/api/odata/v3/. Change the log on credentials to use a specific name and password, and enter your account information. If you are working on a K2-provided VM, the credentials are:
User Name: Denallix\Administrator
Password: K2pass!
and click Next.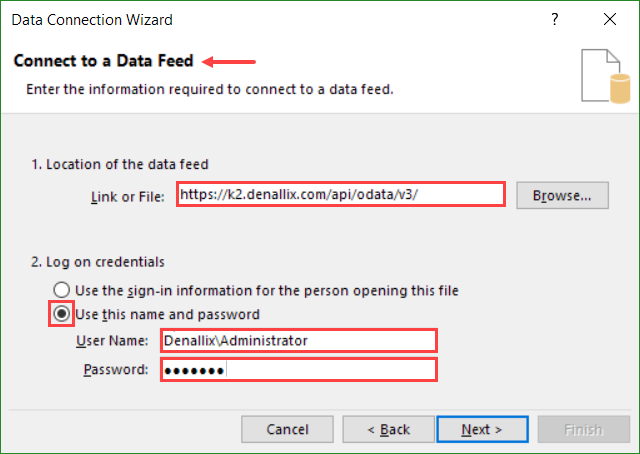
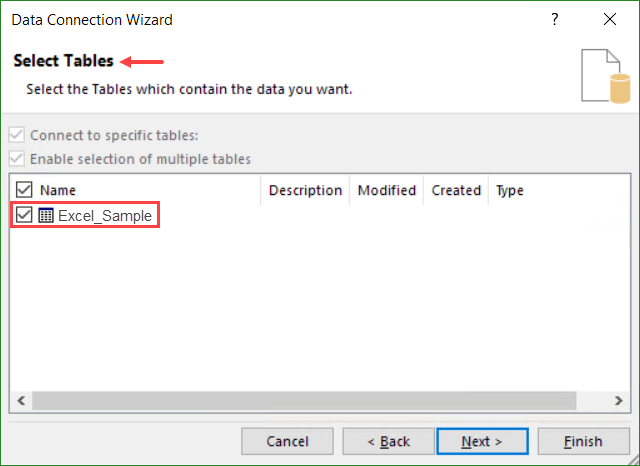
- On the Select Tables screen, select the Excel_Sample table. Click Next.
- There are no changes on the Save Data Connection File and Finish screen, so click Finish.
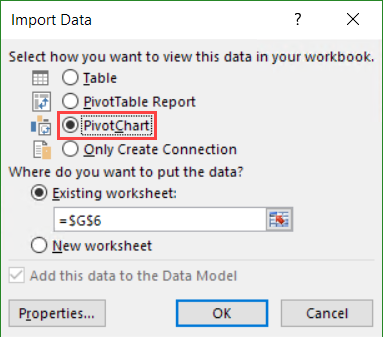
- You now see a dialog on how you want to view the data in your workbook. Select PivotChart and click OK.
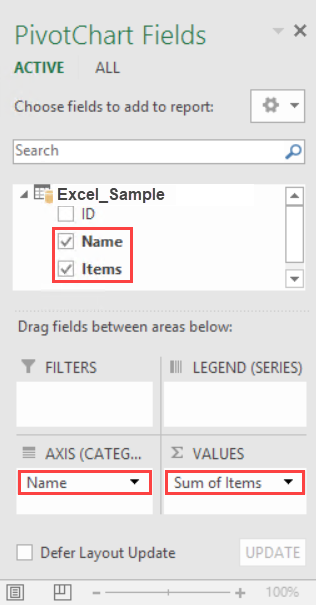
- The last task is to configure the chart fields. First, select Name and Items as the fields to include in the chart. Both fields appear in the Axis (Categories) box at the bottom of the screen. Drag the Items field into the Values box.
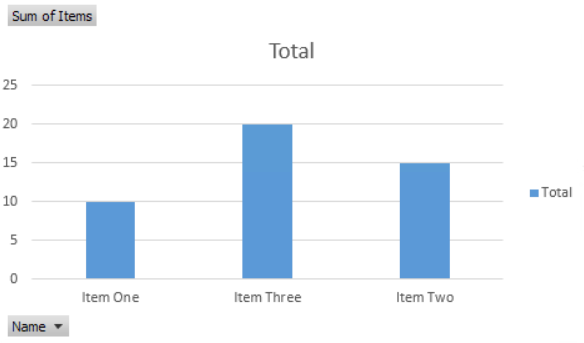
The chart displays data from the Excel Sample SmartObject. The data is in real-time, meaning if it changes, you can refresh the chart and immediately see the updated content.
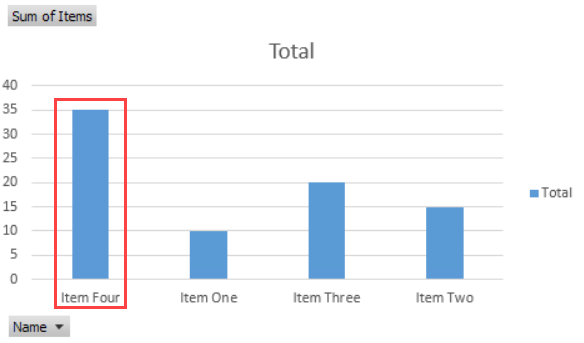
- (Optional) Update the Excel Sample SmartObject by adding a new item. Refresh the chart data and review the results.
In this optional step, you update the Excel Sample SmartObject by adding a new list item. You return to the PivotChart and refresh the content.
- In the Management site, execute the create method on the Excel Sample SmartObject and add a new list item.
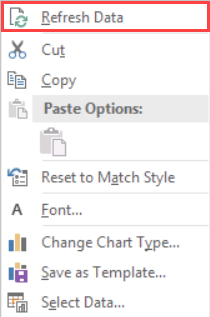
- Return to the PivotChart in Excel. Right-click the chart and select Refresh Data.
The chart reflects the change in real time.
Review
In this demonstration, you enabled the SmartObject OData API and configured it to point to the sample SmartObject created for the topic. Using OData services, you can bring SmartObject data, whether it's system data or data from an LOB system, in other tools that can work with OData connections such as Microsoft Excel and Power BI.