Workflow Duration Chart control
The Workflow Duration Chart control displays a graphic representation of the average duration and count of workflow instances over time, displayed as an aggregated view of the workflow. You can select to display data according to duration or instance count. You can use the chart to:
- Determine which workflows are used most often
- Determine which workflows take the longest to complete
- Identify trends and patterns in usage and load
- Determine the peak usage times for the workflow
- Determine the time periods when it takes the longest to complete the workflow

- Create a view.
- Drag the control onto the canvas. You can find the control in the Reports section of the Toolbox.
- Configure the properties of the control to display the data you want in the chart.
- Run the view.
You can find the control in the Reports section of the Toolbox.
| Property | Description | Can be set in runtime using rules? |
|---|---|---|
| Detail | ||
| Name | A unique identifier for the control. This property is required and defaults to the name of the control. | No |
| Title | The title to display for the control. | Yes, see Configure the Set a Control's Properties Action for more information. |
| Show Title | Shows or hides the title. | Yes, see Configure the Set a Control's Properties Action for more information. |
| Watermark | Specify the text to display if no data is available. | Yes, see Configure the Set a Control's Properties Action for more information. |
| Filters | ||
| Workflow Names | This is the workflow on which you want to filter the data. If you select All, all workflow instances are shown. Click the ellipsis to use the Workflows Picker. You can add more than one workflow to the list. The default setting is All. | Yes, see Configure the Set a Control's Properties Action for more information. |
| Status | You can select specific statuses of the workflow instance you want to filter. Click the ellipsis to use the Status Picker. The default setting is All. | Yes, see Configure the Set a Control's Properties Action for more information. |
| Users | Select users who participate in a workflow instance. Click the ellipsis to use the Users Picker. | Yes, see Configure the Set a Control's Properties Action for more information. |
| Chart Data | ||
| Range | The date range to use to filter the data. The data returned typically executes according to the date on which a workflow instance is started. Select a date range from the predefined drop-down list to filter. Click the ellipsis to use the Date Range Picker. | Yes, see Configure the Set a Control's Properties Action for more information. |
| Group By | The time period to use. | Yes, see Configure the Set a Control's Properties Action for more information. |
| Display Value | This shows how the data is aggregated in the chart. You can select to show the data in duration (how long the workflow instance took to complete) or instance count (the amount of instances per workflow). | Yes, see Configure the Set a Control's Properties Action for more information. |
| Workflow Display | You can display the workflow as stacked, clustered or aggregated
|
Yes, see Configure the Set a Control's Properties Action for more information. |
| Show Label | Shows the labels of each workflow on the chart. | Yes, see Configure the Set a Control's Properties Action for more information. |
| Data | ||
| Participation | The participation type to use to filter the data. Use this type with the Users filter to refine the filter:
|
Yes, see Configure the Set a Control's Properties Action for more information. |
| Display | ||
| Chart Type | You can display the chart as a Column, Pie or Bar chart Column - Displays values as sets of vertical columns that are grouped by category Pie - Is a circular chart divided into sectors. Each sector shows the relative size of each value Bar - Is a chart using rectangular bars with lengths proportional to the values they represent |
Yes, see Configure the Set a Control's Properties Action for more information. |
| Show Grid Lines | Select this option to display grid lines. | Yes, see Configure the Set a Control's Properties Action for more information. |
| Full Spread | Includes date values with 0 instance count and 0 duration. | Yes, see Configure the Set a Control's Properties Action for more information. |
| 24-hour Clock |
Select this option if you want to use a 24-hour clock. For example 20:00 (24-hour clock) vs 08:00PM (12-hour clock). |
Yes, see Configure the Set a Control's Properties Action for more information. |
| Label Angle | The angle at which you can rotate labels to display more effectively when the chart contains more than a few workflows. The default setting is 0. Type a rotation angle, such as 45. | Yes, see Configure the Set a Control's Properties Action for more information. |
| Select Effect | The following effects determines how the control renders when you click an item in the chart: Pie: Fade: The selected item is rendered with an opacity of 100%. All other items are reduced to about 50% (faded out). Explode and Fade: The selected item is exploded. The opacity of all other items are reduced to about 50%. Explode: The selected item is exploded and has 100% opacity. No Effect: All items are rendered with an opacity of 100%. Column: Fade: The selected item is rendered with an opacity of 100%. All other items are reduced to about 50% and faded out Explode and Fade: The selected item has an opacity of 100%. All other items are reduced to about 50% (faded out). Explode: All items are rendered with an opacity of 100%. No Effect: All items are rendered with an opacity of 100%. Bar: Fade: The selected item is rendered with an opacity of 100%. All other items are reduced to about 50% and faded out. Explode and Fade: The selected item has an opacity of 100%. All other items are reduced to about 50% (faded out) Explode: All items are rendered with an opacity of 100%. No Effect: All items are rendered with an opacity of 100%. |
Yes, see Configure the Set a Control's Properties Action for more information. |
| Transition Effect | Applies the Effect | Yes, see Configure the Set a Control's Properties Action for more information. |
| General | ||
| Height | Adjusts the height of the control. You can enter any whole number or pixel value (maximum of 32767px). | Yes, see Configure the Set a Control's Properties Action for more information. |
| Width | Adjusts the width of the control. You can enter any whole percentage up to 100%, whole number, or pixel value (maximum of 32767px). | Yes, see Configure the Set a Control's Properties Action for more information. |
| Visible | Shows or hides the control. | Yes, see Configure the Set a Control's Properties Action for more information. |
| Enabled | Enables or disables the control. If the control is disabled, you cannot interact with the control. | Yes, see Configure the Set a Control's Properties Action for more information. |
| Read-Only | Shows the control as read-only. | Yes, see Configure the Set a Control's Properties Action for more information. |
| Format | Opens the Format page where you can configure formatting and style features such as format, font, borders, padding and margins. See the Format topic for more information. | No |
| Conditional Format | Opens the Conditional Formatting page. You can add conditional formatting to apply a specific format or style when a condition you set is True. Use conditional format on its own or with the Format feature. See Conditional Format for more information. Click the ellipsis to open the Conditional Formatting page. | No |
Report controls interact with each other through rules. When you bind properties between different controls, you can use the data to populate properties or set values. See the following points for using rules with control properties:
- You can use the following property in the context browser when you use rules for mapping to other controls. This property is in addition to those mentioned in the Properties section of this topic, but is only available for interaction with rules:
Selected Range - The range of the column you select. This property returns the start and end dates that you can use in other controls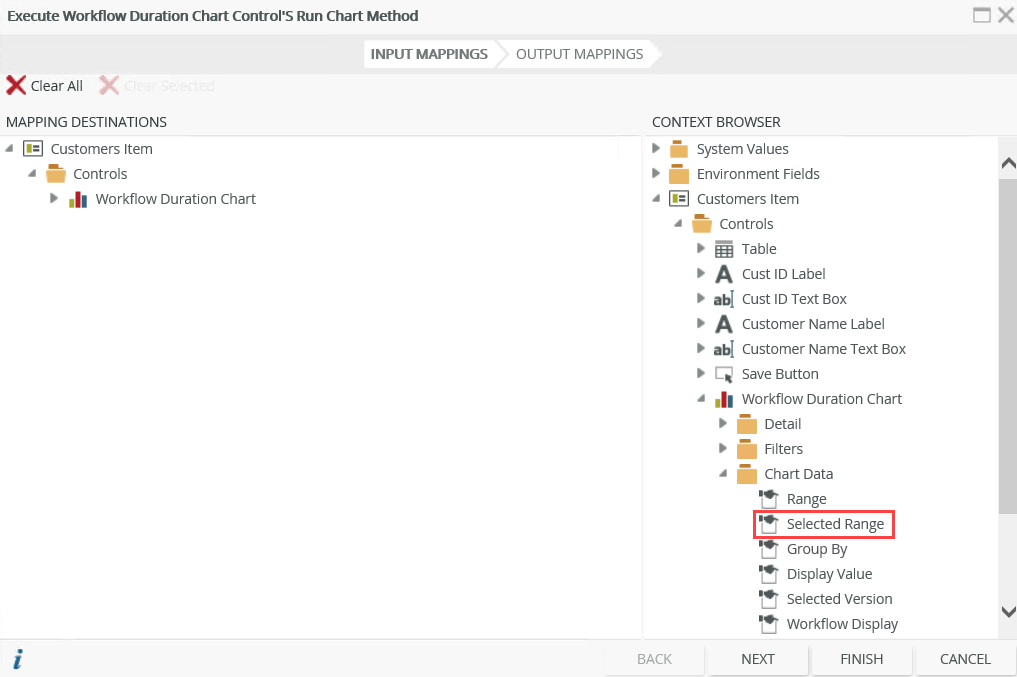
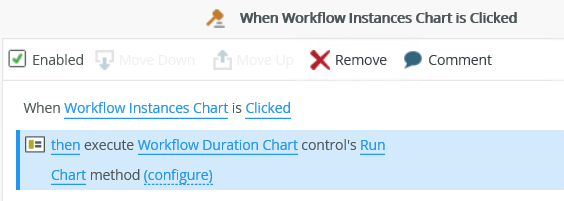
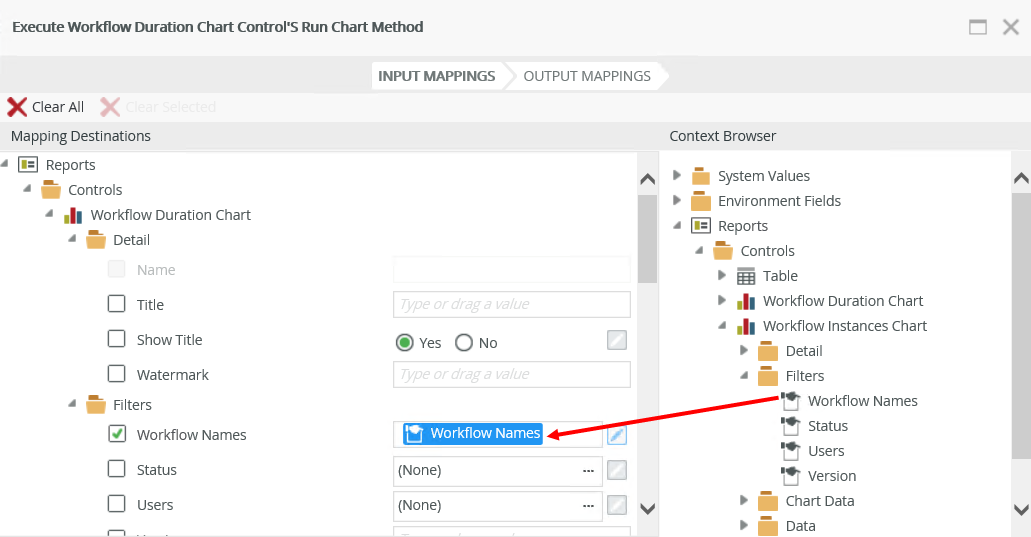
- You can configure a rule to open the Workflow Duration Chart when you click a record in a Workflow Instances Chart. To do this, configure the following rule:
The following events and methods are available on the control:
Rule Events:
- When [control] is Changed: This event executes when the control is set to a new value that is different from the previous value. You can use this event to trigger actions when the control is changed, for example execute the Run method.
- When [control] is Clicked: You can execute a rule condition or action when the control is clicked, for example populate another control.
- When [control] is Populated: This event executes each time the control is loaded. You can execute a rule condition or action when the control is loaded, for example execute the Run method of another report control.
Control Methods:
- Execute a control's Clear method: Clears the workflow data from the control. You can use this method to, for example, clear the workflow data and then execute a Run method using rule mappings of a different workflow.
- Execute a control's Run method: Gets the data from the database, applies configuration and rule settings, and then displays a graphic representation of the average duration and count of workflow instances over time.
Security on the Report controls ensures that the data is seen by only those who are authorized. Permissions are based on the process rights assigned to the process in Management:
- Admin or View permissions: You can access the Report controls.
- View Participate permissions: You can view the Report controls from the point where you are part of the workflow.
- The control is also available when designing forms
- When you use the control together with the Save as PDF control, and you configure a percentage for the width of the control, a pixel width is calculated and used instead. When using the chart with the Save as PDF control, set the width of the control in pixels.
- When you use custom themes, be sure to specify the CSS classes for the elements.
- You can use reporting controls to access the data of workflows created in any workflow designer, including the Designer and Nintex Automation for SharePoint.
- Certain combination configurations can impact performance, for example when you use a range of 90 days, grouped by hours, and you select the Full Spread option. This configuration is (90 days * 24 hours ) = 2160 columns that the chart renders. You can limit the range or deselect the Full Spread option if you experience performance issues.