Debugging Forms
You can debug forms to see the severity of the issue and use the debugging log to create a SmartForms runtime ticket by following the steps below:
- Add an extra query string parameter to the URL of your form: ?_debug=1. This value is the debug level, and you specify a level between one and five, for example, https://denallix.com/Runtime/Runtime/Form/New+Client/?_debug=3.
- When you set the debug level to five only error messages display. The frequency of logging decreases as the debug level number increases. The importance of the message increases as the level increases.
Levels:
1 = Debug
2 = Message
3 = Info
4 = Warning
5 = Error - When you add the debug string to the URL a Show Log button is added to the top right corner of your page. This button shows once a debugging message is logged based on your setting.
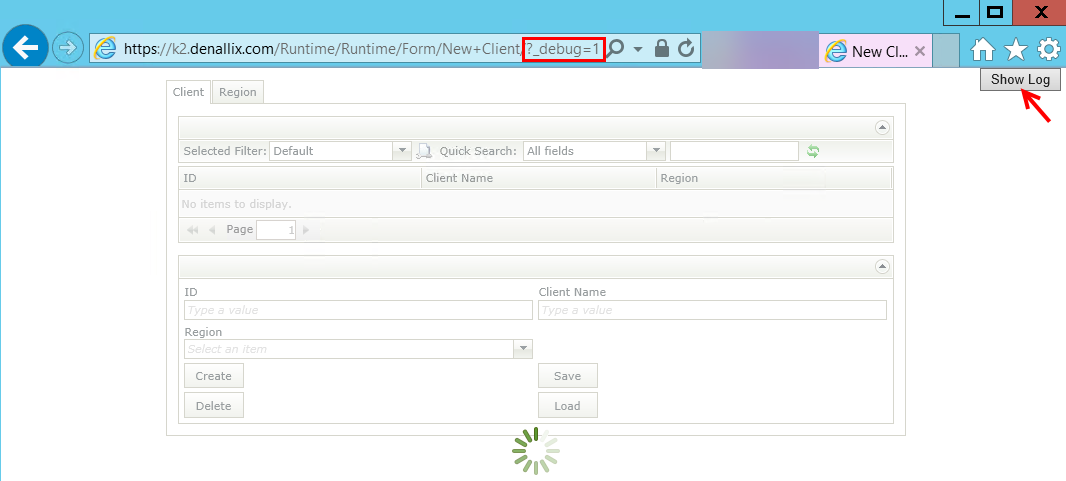
- Click the Show Log button to display the Logging Information.
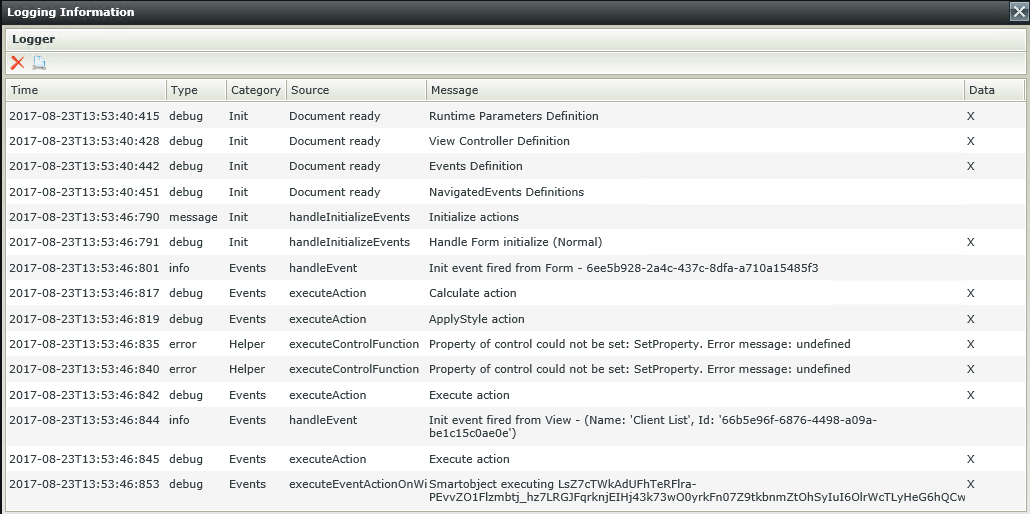
- There are two toolbar buttons on the Logging Information window:

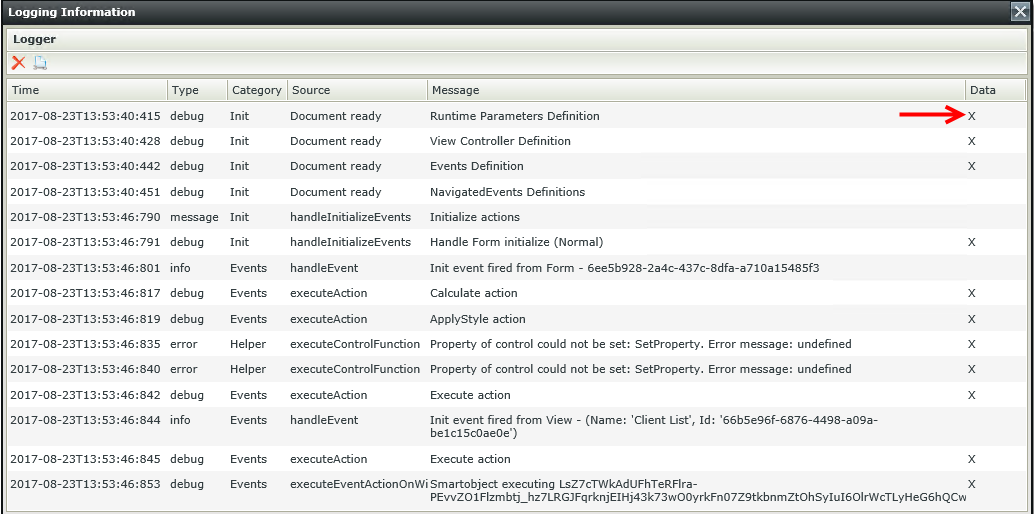
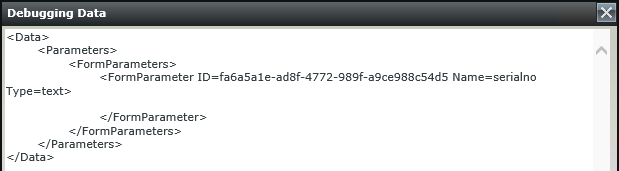
- Rows containing data are marked by an x. When you double click one of these rows you see Debugging Data for the action executed as an example.
- Messages are logged to the browser’s console as well. You must open the console before the event fires on the form. Use the following steps to open the console in the different browsers:
- Internet Explorer /Google Chrome
- Press F12
- Click the Console tab
- FireFox
- Press F12
- Click the Console tab
- Safari
- Press control and comma (ctrl + ,) at the same time
- Click the Advanced tab
- Check show develop menu in menu bar
- Press control alt and c (ctrl + alt + c) at the same time (This is the only step necessary for future use)
Following is an example of the Console in Google Chrome.
- Internet Explorer /Google Chrome
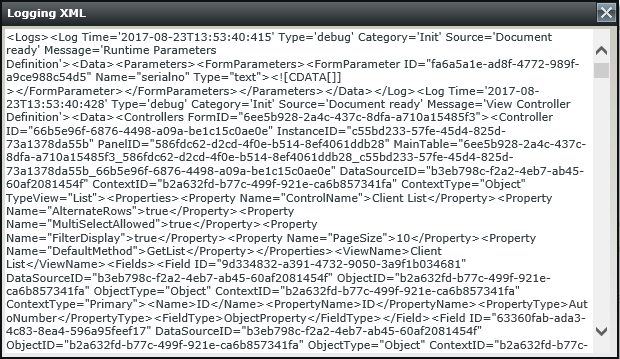
- Some browsers open the XML document when you click the Data or Document at the end of the row.

This is useful if you develop custom controls and need to see what the server was trying to evaluate. You can also get this data in any browser using the steps below.- If you use Firefox's developer tools you need to pause on uncaught exceptions. To turn this on click Debugger and then click the pause button as shown below.

- This allows you to break where the exception occurs and have a full expandable call stack that opens the code for the function.
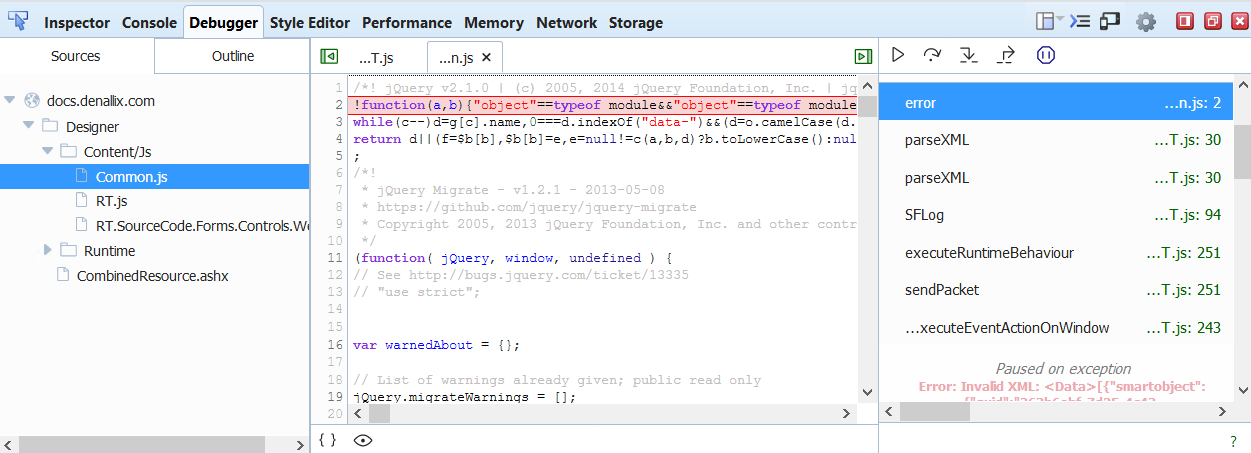
- If you use Firefox's developer tools you need to pause on uncaught exceptions. To turn this on click Debugger and then click the pause button as shown below.