User Performance Report - Overview
The User Performance Report displays the statistics on the users' performance in the process. This includes the average duration that a user has taken to perform a task as well as the number of instances the user is involved with.
The User Performance Report Main Page
The User Performance Report Main Page can be accessed by clicking on the User Performance link under the Reports section of the K2 Workspace Main Page
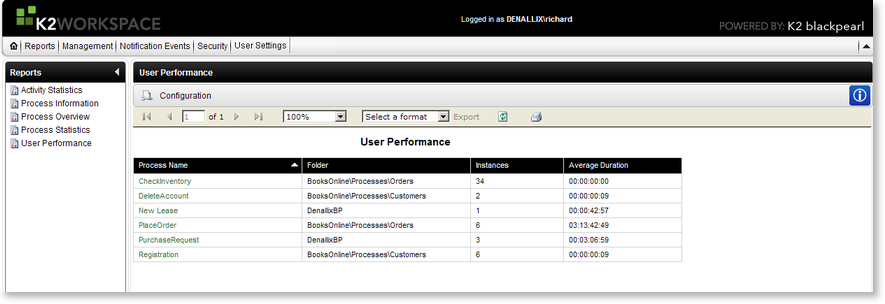
Fig. 1. User Performance Report Main Page
| Feature |
What it is |
How to use it |
| Configuration |
The Configuration tab provides the means of configuring the report's display |
Click on the Configuration tab to configure the report |
| Report Viewer Toolbar |
Enables the user to move to various pages in the report and to export the report into a different application |
Hover over the icons to display the Function name. Click on the required function. |
| Export |
The report can be exported PDF and Excel |
Select the format the report is to be exported to from the drop down list and click on the Export link. The Export link will become available when an export format is selected. |
Export Options
| Format |
Description |
Recommendation |
| Acrobat (PDF) file |
Saves a report as a PDF file that can be opened in Adobe Acrobat Reader (version 6.0 or later) |
Use this format to print paginated reports or to create PDF versions of a report |
| Excel |
Saves a report as a Microsoft Excel file |
Use this format to work with your report data in Microsoft Excel 2000 or later |
Report Data
| Feature |
Description |
| Process Name |
Displays the Process Name as defined in K2 for Visual Studio |
| Folder |
Displays the Project folder where the Process was created in K2 for Visual Studio |
| Instances |
Displays the number of started instances of a specific workflow Process |
| Average Duration |
Displays the time period of the Process from the start until the present |

