View Flow - Workflow
The Workflow tab of the View Flow represents the steps of the process and which route has been taken.
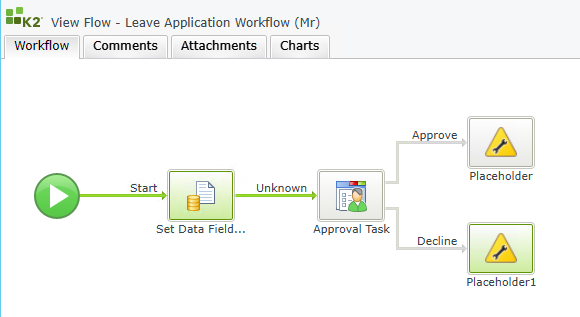
 |
To interpret a View Flow diagram remember:
|
Process Summary
When clicking on the Start activity, the Process Summary dialog opens which contains the Overview and Process Data tabs.
The Overview tab contains the details of the Process.
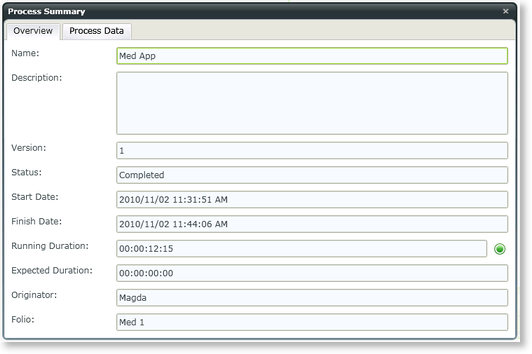
Fig. 2. Process Overview
| Feature | What it is |
|---|---|
| Name | This is the Name of the Process as configured in the process designer |
| Description | This is the Description as configured in the process designer |
| Version | This is the version of the Process for which a Process instance was started |
| Status | This is the status of the Process instance e.g. completed, active, error etc |
| Start Date |
This is the date that a Process instance was started |
| Finish Date |
This is the date that the Process instance was finished |
| Running Duration |
This is the actual duration of the Process instance from the start until the present or until completed. The dot next to the Running Duration represents whether it was completed within the expected duration or not.
|
| Expected Duration | This is the expected duration of the Process instance configured in the process designer |
| Originator | This is the person where the Process instance originated from, i.e. the person who started the Process instance |
| Folio | This is the Folio used when the Process instance was started |
The Process Data tab contains the details of the Process Data Fields. Columns can be resized by dragging the column lines as required.
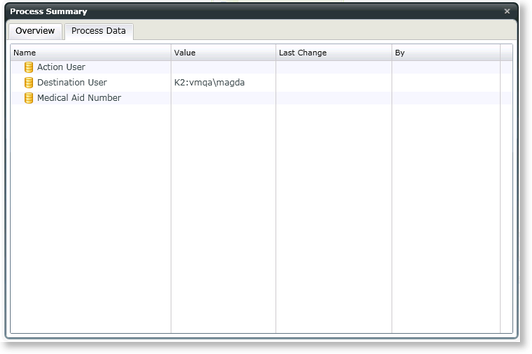
Fig. 3. Process Data
| Feature | What it is |
|---|---|
| Name | The name of the data field |
| Value | The value of the data field |
| Last Change | If the current value is different from the initial (default) value, this field will be populated with the date it was changed. |
| By | If the current value is different from the initial (default) value, this field will be populated with the person who last changed the data field |
If the value of a Data Field or XML Field has changed in the process, an Audit Trail link will be displayed. Click on the link to view the changes

Fig. 4. Audit Trail
Activity Summary
When clicking on an Activity, the Activity Summary dialog opens which contains the Overview, Participants, Activity Data and Events tabs.
The Overview tab contains the details of the specific Activity.
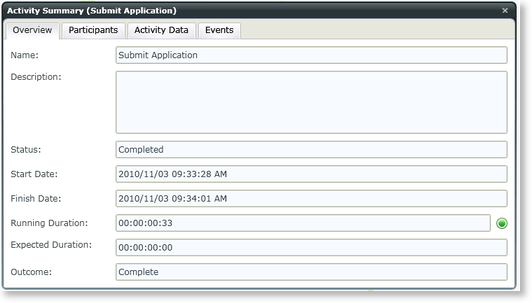
Fig. 5. Activity Overview
| Feature | What it is |
|---|---|
| Name | This is the Name of the Activity as configured in the process designer |
| Description | This is the Description as configured in the process designer |
| Status | This is the status of the Activity instance e.g. completed, active, error etc |
| Start Date |
This is the date that an Activity instance of the workflow Process was started |
| Finish Date |
This is the date that an Activity instance of the workflow Process was finished |
| Running Duration |
This is the actual duration of the activity from the start until the present or until completed. The dot next to the Running Duration represents whether it was completed within the expected duration or not.
|
| Expected Duration | This is the expected duration of the Activity instance configured in the process designer |
| Outcome | This is the Outcome as configured in the client event wizard of the process designer. |
The Participants tab contains the details of the participants of the activity. Columns can be resized by dragging the column lines as required.
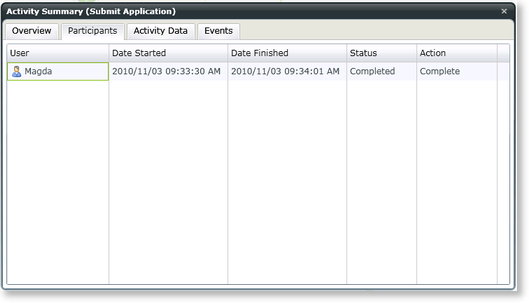
Fig. 6. Activity Participants
| Feature | What it is |
|---|---|
| User | The user who participated in the Activity instance of the workflow Process |
| Date Started |
This is the date that an Activity instance of the workflow Process was started |
| Date Finished |
This is the date that an Activity instance of the workflow Process was finished |
| Status | This is the status of the Activity instance e.g. completed, active, error etc |
| Action | This is the Action performed by the participant. The available actions are related to the Outcomes as configured by the process designer |
The Activity Data tab contains the details of the Activity Data Fields. Columns can be resized by dragging the column lines as required.
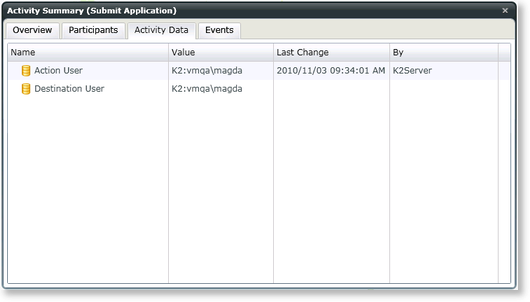
Fig. 7. Activity Data
| Feature | What it is |
|---|---|
| Name | The name of the Data Field |
| Value | The value of the Data Field |
| Last Change | If the current value is different from the initial (default) value, this field will be populated with the date it was changed. |
| By | If the current value is different from the initial (default) value, this field will be populated with the person who last changed the value |
The Events tab contains the details of the Events of the Activity. Columns can be resized by dragging the column lines as required.
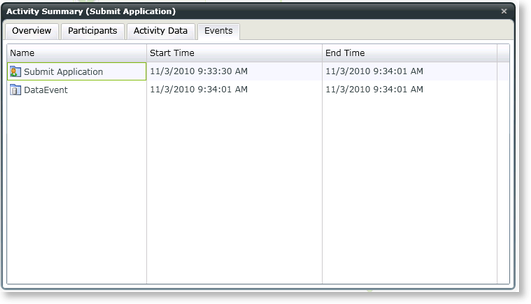
Fig. 8. Events
| Feature | What it is |
|---|---|
| Name | The name of the Event |
| Start Time | The start time of the Event |
| End Time | The end time of the Event |
Event Details
To access the Event Details, open the Activity Summary as mentioned above, select the Events tab and double click on the Event. The Event Details dialog will open.
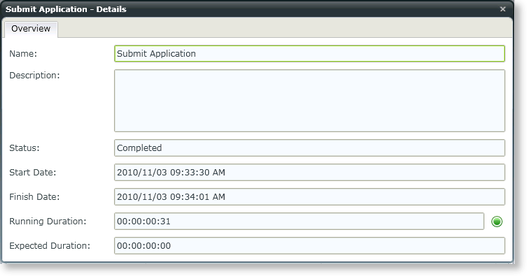
Fig. 9. Event Details
| Feature | What it is |
|---|---|
| Name | This is the Name of the Event as configured in the process designer |
| Description | This is the Description of the Event as configured in the process designer |
| Status | This is the status of the Event e.g. completed, active, error etc |
| Start Date |
This is the date that this Event instance was started |
| Finish Date |
This is the date that this Event instance was finished |
| Running Duration |
This is the actual duration of the Event instance from the start until the present or until completed. The dot next to the Running Duration represents whether it was completed within the expected duration or not.
|
| Expected Duration | This is the expected duration of the Event instance configured in the process designer |
IPC Event
If an IPC Event is used, a link is available to open the View Flow of the sub process. Click on the link to open the sub process.
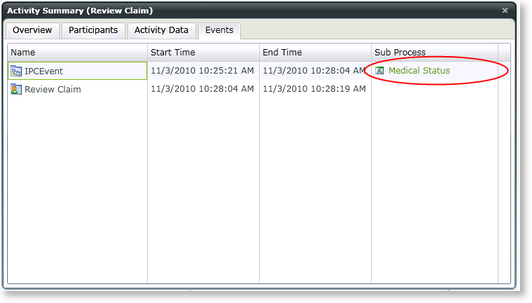
Fig. 10. IPC Event
The View Flow of the sub process is opened. From here, the Process and Charts tabs of the sub process can be accessed .
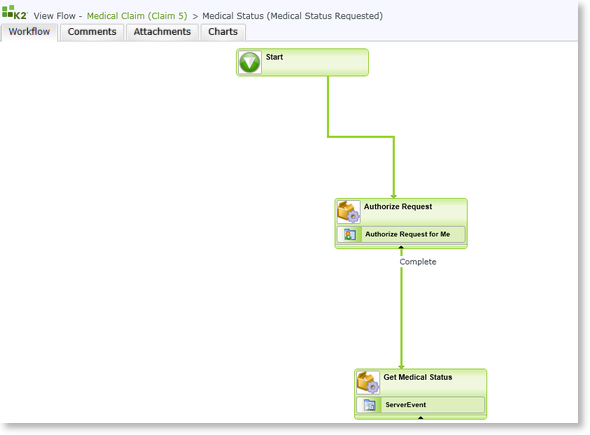
Fig. 11. Sub Process
Should you wish to return to the main process' View Flow, click on the link in the heading.
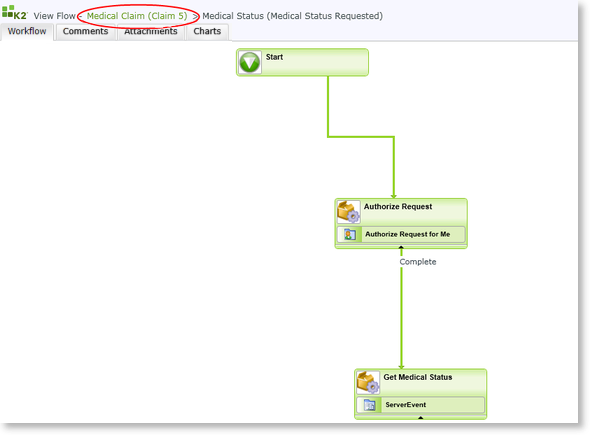
Fig. 12. Main process link
