View Flow - Charts
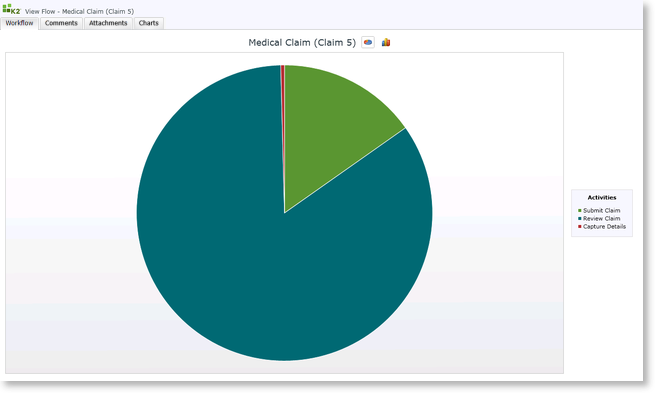
The Charts tab of the View Flow represents the activities in relation to each other graphically. The Pie Chart is opened by default.

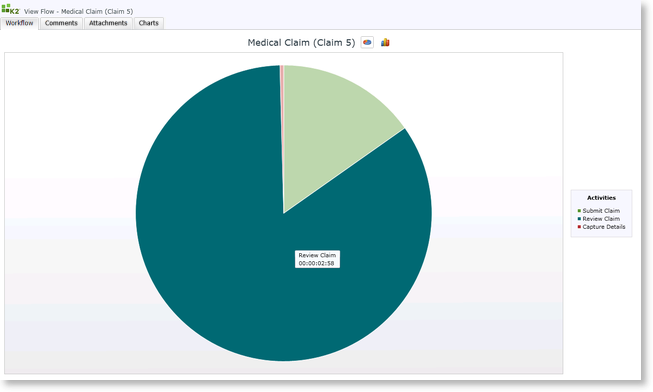
When hovering over an activity, the activity name is displayed with the running duration.

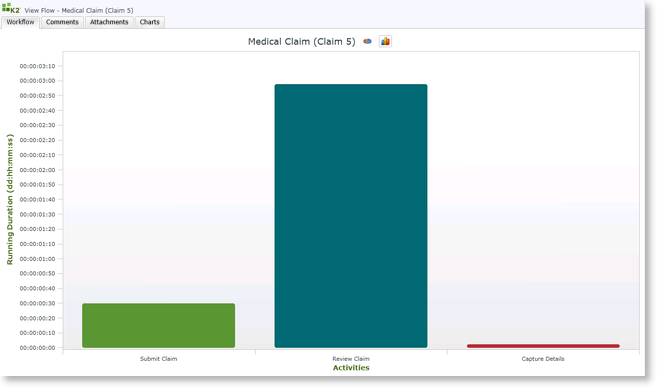
Click on the Bar Chart icon![]() to open the Bar Chart. To return to the Pie Chart, simply click on the Pie Chart icon
to open the Bar Chart. To return to the Pie Chart, simply click on the Pie Chart icon![]()

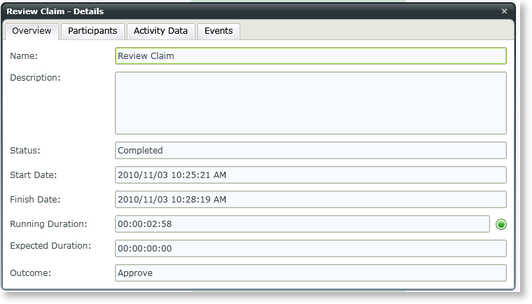
When clicking on the Activity within the Bar Chart or Pie Chart, the Activity Details dialog opens from where the Overview, Participants, Activity Data and Events can be selected. In the Pie Chart, the Activities in the box on the right can alternatively be clicked on to open the Activity Details.

Fig. 4. Activity Details
See Also
