Improvements Add-on example: Report based on form fields
This topic describes an example of how you can:
- configure relationships between the Incident and IncidentField table data and
- add a PivotTable to create a report based on the form fields.
Before you start Use the steps in Query using Microsoft Excel to create a spreadsheet mapped to the Incident and IncidentField data.
- Open the Microsoft Excel file you have saved and from the Workbook Queries column displayed on the right, click the query name to load the corresponding sheets and rename as Incidents and IncidentFields for clarity.
- Click Incidents and then click Data > Relationships.
- In the Manage Relationships dialog, click New.
- In the Create Relationship dialog, select the following values:
- Table: IncidentFields
- Related Table: Incidents
- Column (foreign): IncidentId
- Related column (Primary): EntityId

- Click OK > Close.
- Click Insert > PivotTable.
- In the Create PivotTable dialog, select the following values:
- Select the Use this workbook's Data Model check box.
- Choose where you want the PivotTable report to be placed: New Worksheet.
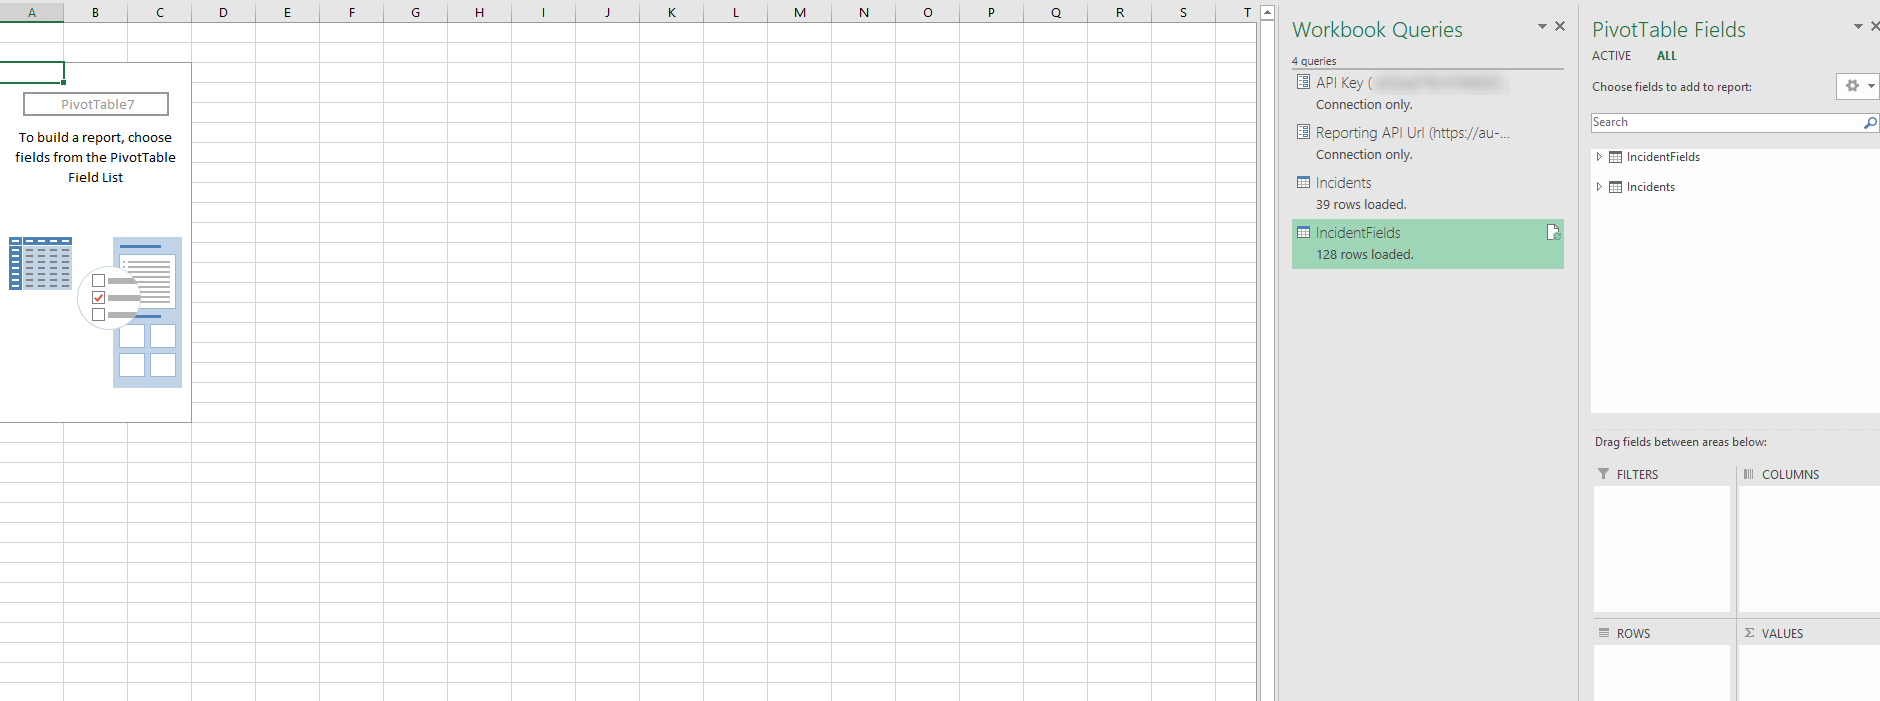
- Click OK. The new worksheet is displayed with the PivotTable. The Workbook Queries and PivotTable Fields columns are displayed on the right.
- In the PivotTable Fields column, drag and drop the fields as follows:
- IncidentFields > IncidentId to VALUES
- IncidentFields > FieldLabel to FILTERS.
- IncidentFields > FieldValue to ROWS.
- Incidents > PortfolioName to ROWS
- Incidents > ReportedDate to COLUMNS. The ReportedDate, ReportedDate (Year), ReportedDate (Month), and ReportedDate (Quarter) columns will be added.
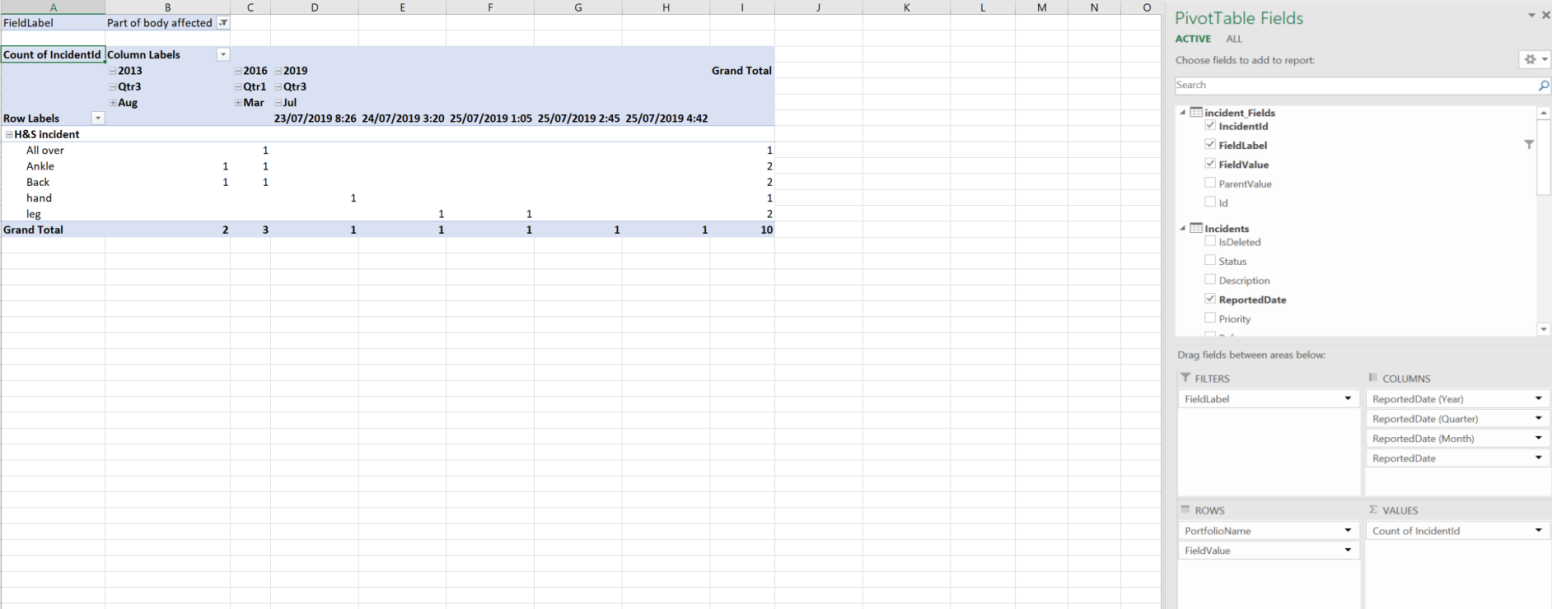
- The PivotTable displays the total number of incidents for each portfolio based on the value you select from the FieldLabel filter as illustrated in the following figure.
- The columns display the Year which can be drilled-down to Quarter and Month.
- Drag and drop the PivotChart fields to customize. For more information about working with PivotTables, see the Microsoft Excel help center.


