Enhancing charts with actions
Nintex Apps offers two chart-specific ways to enrich visualizations with additional data:
- On-click actions let end users click locations on the chart to open modals or sliding panels, navigate to other pages, or perform other actions.
- Chart navigation allows the builder to create a set of nested charts. Users can click from one chart to the next to navigate into a deeper level of the data presented in the preceding chart.
Both options leverage the power of Action flows to add deeper levels of data to charts and geocharts.
On-click actions
On-click actions are added to a chart when configuring the data series. The added action then fires when the end user clicks on the associated series or region data within the chart or geochart.
Note: The following steps assume you have a functioning Chart component, connected to a model with at least one data series created.
Add an on-click action
- Click on the chart component on the canvas and then click the Series tab.
- In the chart's properties pane, expand the Series list.
- Click the Series where you want to add an on-click action.
- Under Series Interactions, click Add and select Add action flow.
You can select almost any action from Action flows to use as an on-click action.
A common use case: the user's click opens a modal or a sliding panel that provides additional data to the chart through a Table, Form, or other visualization components (within that popup or panel).
Split Type charts
Leveraging on-click actions with the Split Type property in the data series is a great way to display different data for each split in the series:
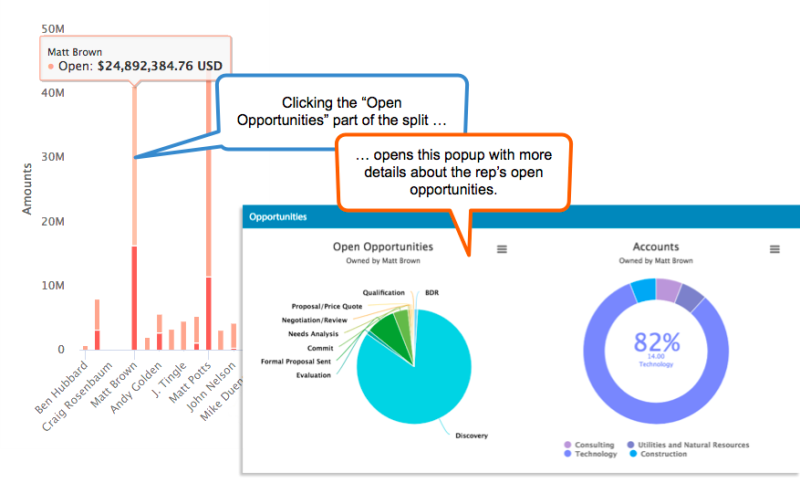
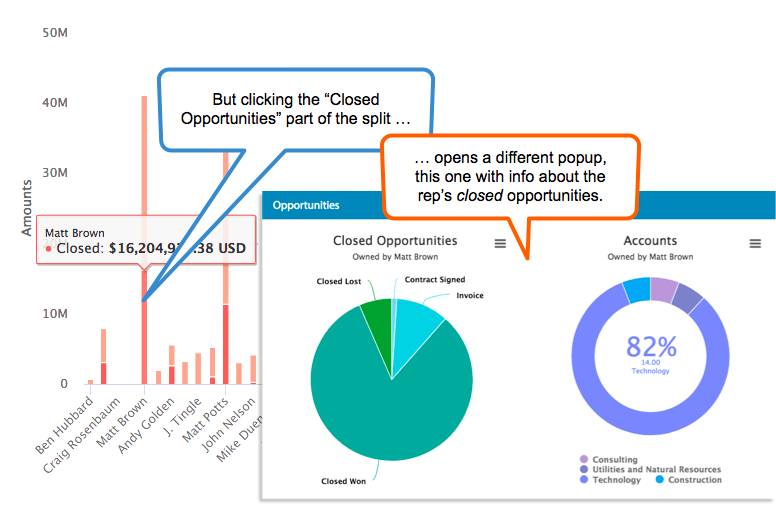
Chart navigation
The navigation feature creates a set of related charts in a hierarchy. For example, when an end user clicks into the top-level chart, Nintex Apps opens the next-level chart. Chart navigation can display additional information from the same model, or related information from a different model. Use either visualization component, chart or geochart, in a chart navigation.
There are two steps to creating chart navigation:
- Adding a new chart to an existing chart to create a Chart Set.
- Creating a Navigate to chart action to link the first chart to the second.
Create a Chart Set
Chart navigation is built on the concept of the chart set, a set of related charts that appear at the same location on the Nintex Apps page.
Note: The following steps assume you have a functioning Chart or Geochart component, connected to a model with at least one data series created.
Convert the current visualization into a Chart Set
- Click on the chart component on the canvas to activate the Add chart button.
- Click Add chart and select one of the options:
- Chart to add a chart to the set
- Geochart to add a geochart to the set
Both visualizations now sit within a container called a Chart Set. You can add multiple visualizations to a Chart Set. Each chart needs configuration and styling.
Delete a chart from a Chart Set
- In the Chart Set, select the chart that needs to be deleted.
- Click the Remove icon to delete the chart or geochart.
Add a Navigate to chart action to connect charts in a chart set
Charts in a Chart Set must be connected to one another with a Navigate to chart action so that they can pass data from one chart into the next one:
- Select a chart in the Chart Set.
- In the chart's properties pane, expand the Series list.
- Click the Series that will pass data from one chart to another.
- Under Series Interactions, click Add and select Add action flow. A new component bound action is added in the Action flow.
- Click + (plus sign) to select and add an action.
- Click the Navigate to chart component-context action.
- In the new Navigate to chart action, check to see that it is configured as follows:
- Action type: Navigate to chart
- Target chart: Select the next chart in the series from the drop down.
- If desired, click Add chart condition. Chart conditions filter data on the target chart based on the end user selections from the source chart.
For example, you can design the target chart to only display data that is in or is not in (depending on the operator selected) the source chart's data and then use source and merge fields to limit the data displayed. You can also create a separate chart on a different model that displays data differently.
Let's say that you have a bar chart with opportunities grouped by rep. If you click on a bar with opportunity records, the next chart displayed contains other information related to that rep, for example, a breakdown of their tasks this month. The chart condition would reference who owns the opportunities, rather than the opportunity records themselves, to filter the data in the target chart.
In another use case, you could have a chart with opportunities displayed by rep. If you click on a bar with opportunity records, a slice, or series split, of records within that bar is displayed, for example, that subset of opportunity records grouped by stage or close date. You can add a chart condition on the record Id field to display only those records.
- Under Source field, click Add field and select the field on the source chart to compare data against.
- Select the in or not in Operator.
- Under Merge field, click Add field and select the field on the target chart to filter its data based on the source field and operator.
Repeat these steps for any visualization in the Chart Set where you'd like the user to navigate to another chart.
Use context with chart actions
In a common use case for on-click actions, the end user clicks a chart item to open a popup or sliding panel with additional information about that item. Similarly, with chart navigation actions, the user clicks an item on the first chart to open the second chart with more information on that item.
Nintex Apps knows what content to display by using context: passing in a specific value for the data that was clicked—a parameter—into the follow-on charts or components.