* This topic applies to Nintex Workflow Enterprise Edition only
Use the Nintex Chart Viewer web part to display a Nintex Workflow report in graph/chart view on a page within a site.
To use the Workflow Chart Viewer web part:
- Navigate to the page of the site to which you want to add the web part.
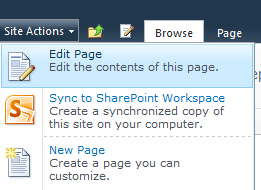
- Click on the Site Actions menu, then click on Edit Page.
- Click within the Rich Content area, where the web part is to be inserted.
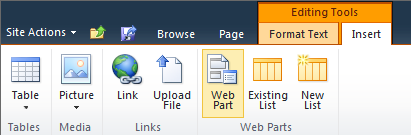
- In the Ribbon, click on the Insert tab, then click on Web Part.
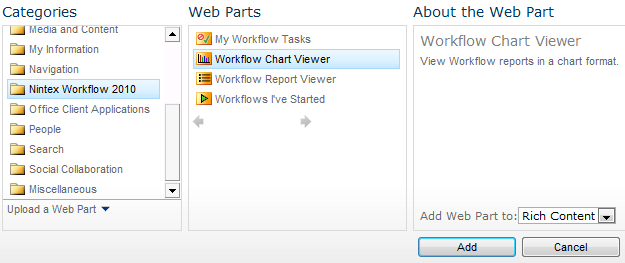
- In the Categories section, click on Nintex Workflow 2010.
- In the Web Parts section, click on the Workflow Chart Viewer.
- Click the Add button.
- Edit the settings for the web part, click the
 to activate the web part menu, then click on Edit Web Part.
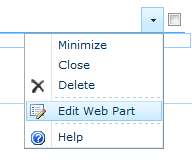
- A series of options will be shown in the tool pane to the right of the page that are specific to this web part.
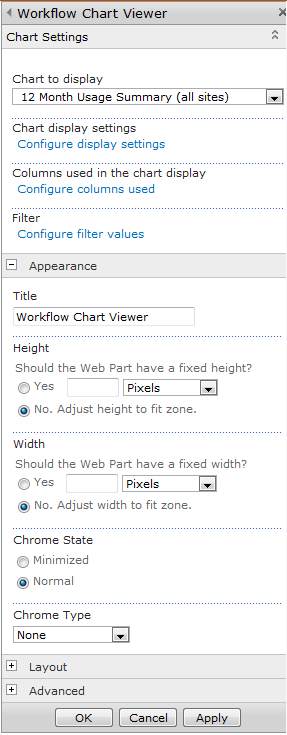
Web Part Settings: Chart Settings
Chart to display
- Select the chart to display from the drop down list.
Note: This list is configurable by the Administrator in SharePoint Central Administration.
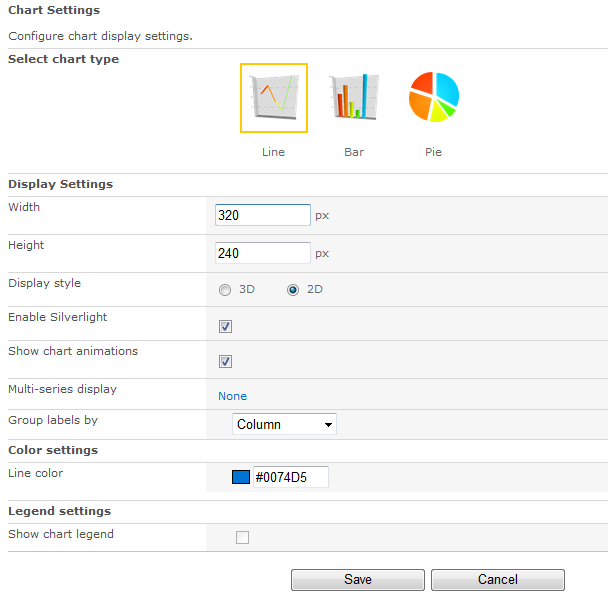
Chart display settings
- Click on the Configure display settings link to set the chart type, display settings, color settings and legend settings of the chart.
- When all settings are configured, click the Save button.
Note: If Enable Silverlight is checked, ensure that users have Microsoft Silverlight installed in order to view the Workflow Charts.
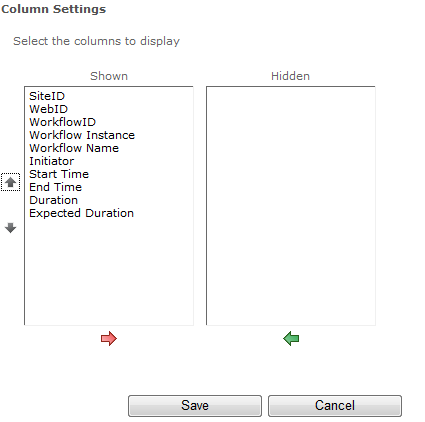
Columns used in the chart display
- Click on the Configure Columns used link to select which columns are to be shown in the chart. By default, all columns are included.
- Select a column in the Shown section and click on
 to remove from the Chart display.
- Select a column in the Hidden section and click on
 to shown in the Chart display.
- When all settings are configured, click the Save button.
Note: The first column displayed in the list becomes the x-axis value. The remaining columns become the y-axis. For example: To chart the number of tasks for each approver, add the "Approver" column as the first column and place the numerical value columns below the "Approver" column.
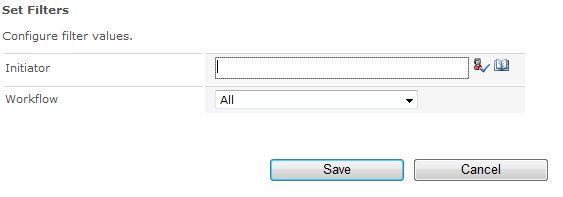
Filters
-
Click on the Configure Filter Values link to set filter values for the report.
-
When all settings are configured, click the Save button.
Note: Not all reports accept filter values.