How to: Use the K2 OData Feed with Microsoft Excel
Exposing SmartObject data through the SmartObject OData API provides powerful integration with third party tools like Excel. This topic shows you how to access the service in Excel to analyze and chart SmartObject data using Excel functionality.
Using the OData service, you can build custom reports and other interfaces based on SmartObject data. Create custom reports using workflow reporting data and data stored in a line of business system as long as you have SmartObjects created for that system.
Some third-party software (for example PowerBI and Excel) have alternative OAuth implementations and do not work with the standard OAuth mechanism used in K2. In these cases, you will only be able to use Basic Authentication when connecting the software to the SmartObject OData Services.Before You Begin
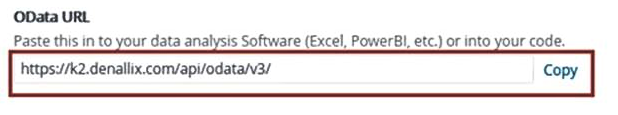
You must enable the SmartObject OData API and configure SmartObjects first. See Configuring the SmartObject OData Service. Copy the URL for the OData Feed connection from the Management page.
Steps
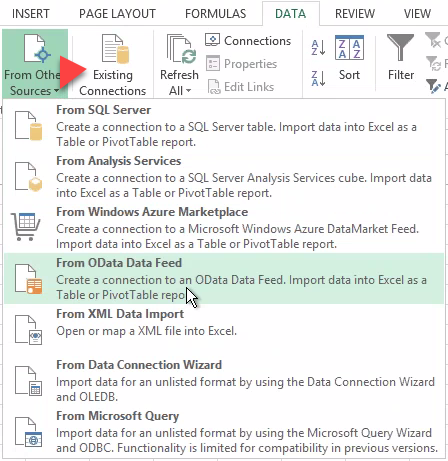
- In Excel, select the DATA tab and the click on the down arrow of the From Other Sources option. Then click From OData Data Feed.
- Paste the OData URL into the Location of the data feed text box. Then, in the Log on credentials, select the Use this name and password, and type in yourUser Name and Password. The feed URL is on the K2 Management page:
The OData API is an IIS-hosted app and configured with Basic authentication that requires your Active Directory username and password (or Azure Active Directory if K2 is in the cloud).
IIS performs the initial authentication and authorization and then pass the user’s credentials to the K2 server. At this point, the user is authenticated again.
You can pre-select a SmartObject in the OData feed by adding the name of that SmartObject to the end of the OData URL. For example: https://k2.denallix.com/api/odata/v3/MYSMARTOBJECTNAME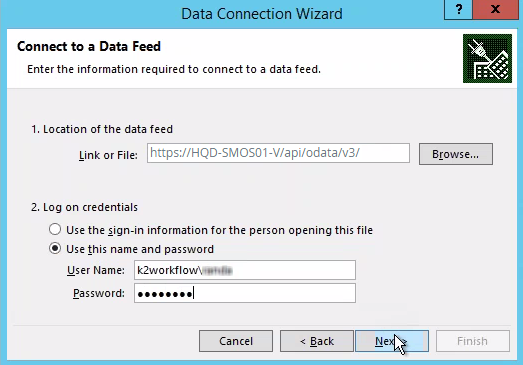
- Click Next.
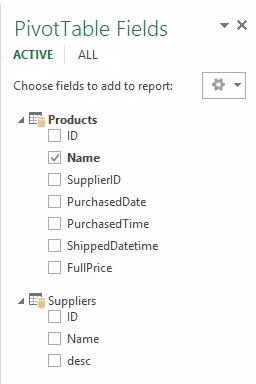
- Select the SmartObjects that you want to add to the spreadsheet.
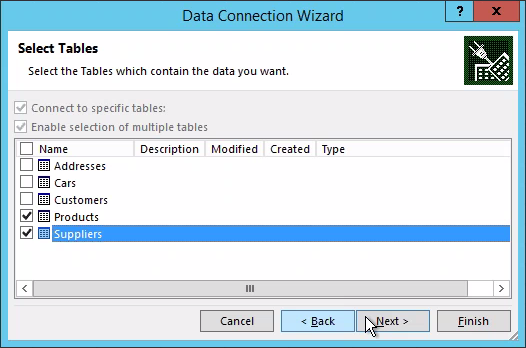
- Click Finish.
- Select how you want the SmartObject data to be viewed in the spreadsheet, and the location in the spreadsheet.
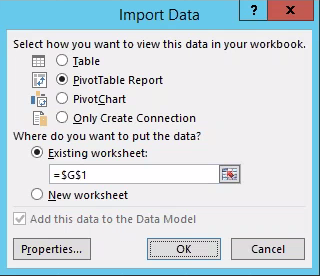
- Click on OK.
- Now that the data is available in Excel, you can use standard Excel analysis and reporting features, such as PivotTables, to design and build your reports.