Debugging Custom Controls
Custom controls can be debugged in a number of ways, depending on the code or behavior you wish to debug:
- Debug SmartForms integration and Rules using the standard SmartForms debugging mechanism.
- Debug client-side code, styling and performance issues using standard browser developer tools.
- Debug server-side code with Visual Studio.
K2 smartforms uses caching to increase performance, this is not necessarily useful when debugging a custom control. You can clear that cache yourself by using your environment details with the following URL: https://[sitename]/[designer or runtime]/cachecontrol.ashx?m=clear
Updating Custom Controls
You only need to re-register your control with the controlutil.exe utility if the control definition XML file has changed. If you have only changed the server-side code or embedded files, you only need to copy the updated files to the web servers; it is not necessary to re-register the control if the control type definition XML file has not changed.
It is recommended to perform an IIS reset of the at least runtime web site (preferably both runtime and designer sites) whenever you update your custom control .dll file. Remember also to force-clear your browser's cache whenever you update your control, to make sure that you are getting the latest client-side files.
Debugging Custom Controls using browser developer tools
When debugging client-side issues (such as JavaScript, HTML or CSS), the best approach is to use a developer plug-in tool for a browser. The most popular are the Internet Explorer Developer tools (F12) in IE, firebug for Firefox and the built-in developer tools provided with Google Chrome. You could also use the old standby of using alert(); statements in your .js code to show message boxes during your code. Just remember to disable these before you go to production.
Using non-minified JavaScript files for debugging
By default, the standard .js files used by SmartForms are compressed ("minified"). While this saves on bandwidth, it can make troubleshooting tricky because it is hard to debug a minified .js file. If you need to debug the standard .js files provided with SmartForms, change the web.config files for the design-time and/or runtime websites and change the setting UseBundledFiles to false. This will serve up the "full", non-minified version of the included .js files which makes client-side debugging easier.
Debugging Custom Controls server-side code with Visual Studio
Just like a normal ASP.NET project, you can use Visual Studio's Remote Debugging tool to debug the server-side code in your custom control by attaching the project to a running instance of a SmartForm / View with your control. Remember that you should always copy the .dll file and.pdb file for your assembly to the smartforms web sites if you want to perform server-side code debugging.
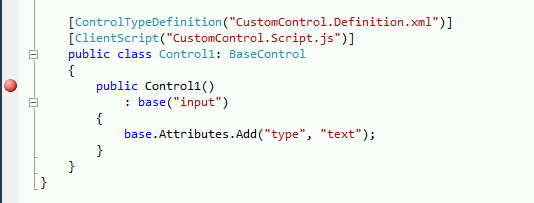
- Add break point to your code.
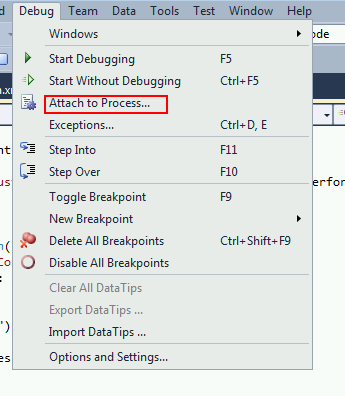
- Use the debug menu and select Attach to process option.
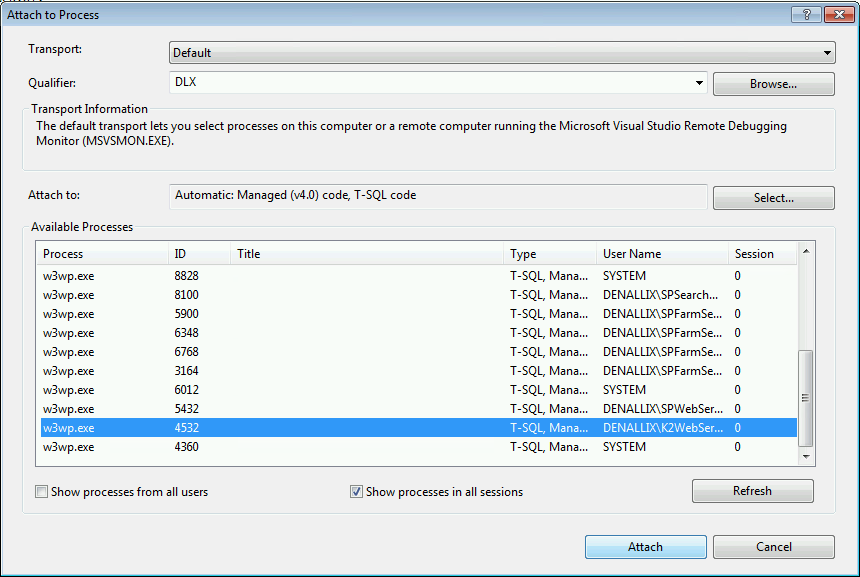
- Attach to the w3wp.exe process of the app pool hosting the SmartForms Runtime environment to debug runtime issues, or the app pool hosting the K2 Designer website to debug design-time issues.
- Refresh the web page with the control, a break point in Visual Studio should be launched and you can trace through your code from there.
- When done you can simply stop debugging and continue with fixes.
You should copy the assembly debug symbols file (.pdb) to the K2 smartforms Designer and Runtime website's bin directories, otherwise the breakpoint may not be hit when you attach to the w3wp process.