Debugging a K2 workflow (legacy)
This content applies to legacy components (such as K2 Studio and K2 for Visual Studio), legacy assemblies , legacy services or legacy functionality. If you have upgraded from K2 blackpearl 4.7 to K2 Five , these items may still be available in your environment. These legacy items may not be available in new installations of K2 Five . These legacy items may also not be available, supported, or behave as described, in future updates or versions of K2. Please see the legacy component support policy for more information about support for these components.
Debugging a K2 workflow at runtime is much like debugging other server-based applications since it requires attaching to the K2 Server application. Once attached to the server application you can set breakpoints, add watches, and perform any other typical debugging functions.
Considerations
- It is important to disable the 'Require source files to exactly match the original version' option on the Options > Debugging > General screen of Visual Studio for the debugging functionality to function correctly.
- If trying to remotely debug a process, ensure that the Visual Studio Remote Debugger service is started on the remote machine and that the user debugging is part of the Debugger Users group.
- You must have either Administrator privileges or be part of the Debugger Users group on the server machine in order to debug.
- Setting breakpoints in the Workflow Foundation visual designer is not possible. However, setting breakpoints in the XOML code behind is.
- For API-only applications, such as some of the examples included in this reference and other non-process applications, in most cases attaching to the K2 server is not necessary in order to debug.
- Breakpoints for a .NET runtime application might NOT be hit if the Debug > Start External Program option is used. This means that attempting to debug a startup application such as K2HostServer.exe the breakpoints will not be hit. To solve this add a configuration file next to the native executable as explained in http://msdn.microsoft.com/en-us/library/605a12zt(v=vs.100).aspx. Alternatively, start the K2HostServer.exe process independently and then attach to that process.
The K2 Server will halt all processing when a breakpoint is active. Therefore, debugging should be performed only on development or test machines. Production servers should only be debugged when absolutely necessary.
Step By Step: Debugging a workflow
The steps below assume you are working on a development machine where Visual Studio and the K2 Server are both installed locally.
- Design a process and deploy it.
- Right-click the activity you want to debug and then click View Code > Event Item.
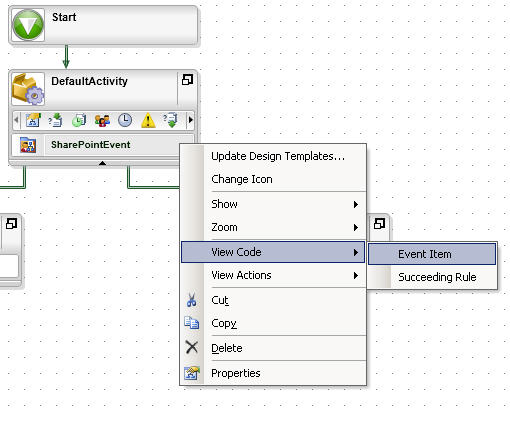
- If the Workflow Foundation designer appears, right-click one of the items and then click View Code.
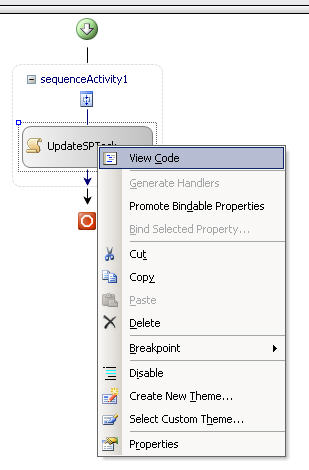
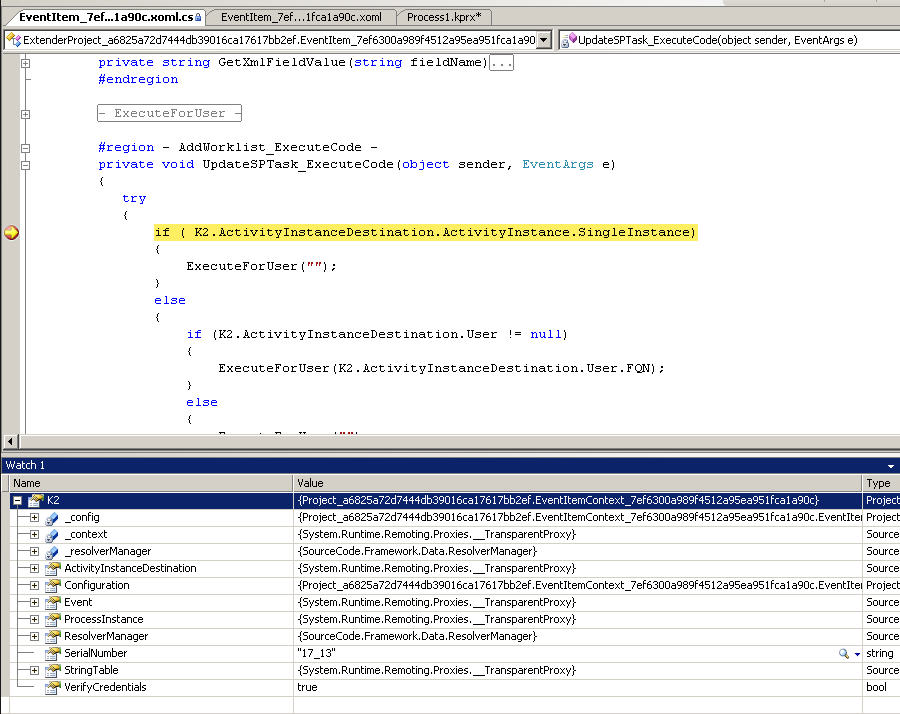
- Scroll to an area of interest in the code and set a breakpoint.
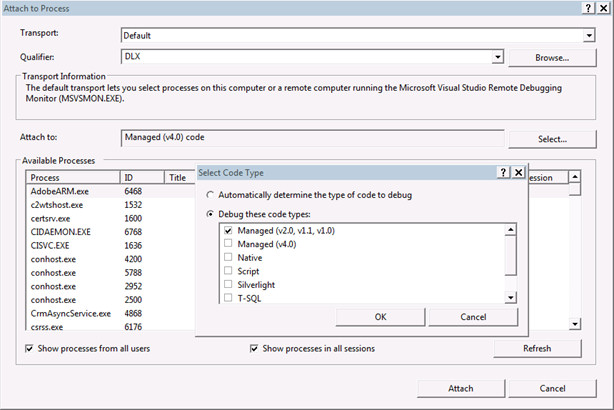
- On the Debug menu in Visual Studio click Attach to Process.
- Click the Show processes from all users option.
- Scroll through the Available Processes list and select K2HostServer.exe.
- Click the Select button in the Attach to option.
- In the Select Code Type dialog box, click Debug these code types and then put a check mark next to Managed.
- Click OK.
The Attach to Process dialog box should resemble the following figure
- Click Attach
- On the Attach Security Warning dialog click Attach.
- Start an instance of the process or action the process, depending on your process and the stage at which you are debugging.
- When the breakpoint is hit the Visual Studio window should become active and you will see the breakpoint highlighted as in the following figure.