32. Use the Expense Claim Reports
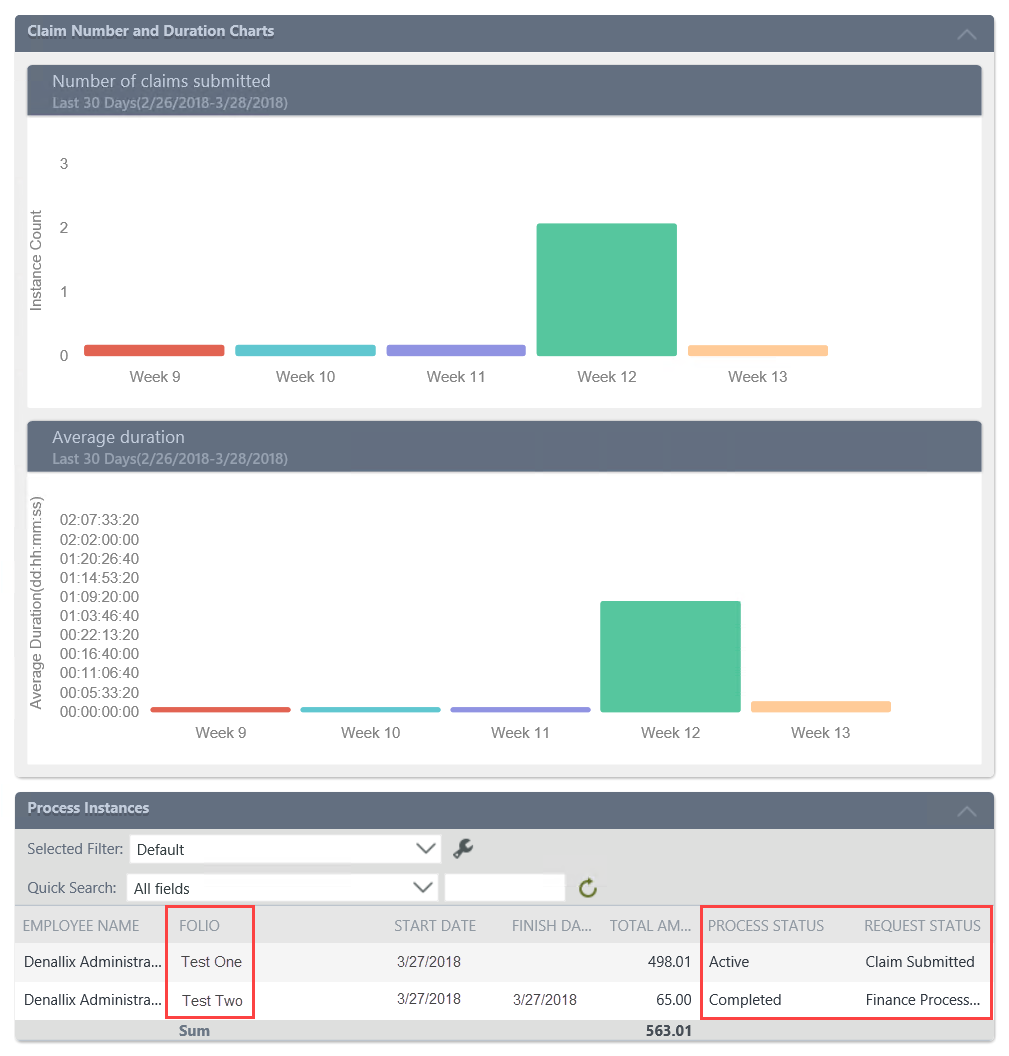
In this step, you will test your expense claim reporting dashboard by running the form and reviewing the results returned. You should see data for the two chart controls. The first chart returns the number of claims and the second chart returns the average duration of claims. Below the chart controls, you should see the list view with data returned from the composite SmartObject.
- Check-in the reporting views and form. Use the Runtime URL for the Expense Claim Report Dashboard to launch the form in a new browser tab.
- Check in the Expense Claim Report Dashboard form. When you see the warning about checking in associated views, CHECK the option to Check in associated Views, then click OK.
- Select the Expense Claim Report Dashboard form. In the central pane, click the Runtime URL. The form launches in a new browser tab.
- Review the dashboard results. (Your screen may not match the image below exactly.) Notice in particular the Process Instances view. This list returns data from your composite SmartObject. You are viewing data from two different data sources. The FOLIO values, for example, are coming from the Process Instance SmartObject. This data is collected by Nintex K2 behind the scenes for each process instance started. Notice the two status columns. The PROCESS STATUS column reflects data from the Process Instance SmartObject and is the status of the process instance overall. The REQUEST STATUS data is coming from the Expense Claim Header SmartObject and reflects the status of the workflow activities, or steps.

- After reviewing the dashboard reporting data, you can close the browser window. You have completed the Expense Claim tutorial!
Review
In this step, you ran the reports form and reviewed the data for Expense Claim process instances. In the next step, you learn how to clean your learning environment by deleting the artifacts created in this tutorial.