Report on Survey Apps
The Survey app has three reporting tools: Process Overview Report, Survey Data & Participants, and Export to CSV. You can use the Process Overview Report to view details on each instance of the survey, for example, the number of active surveys or the number of completed surveys. With this report you can drill down into instance details to view task assignments, durations and decisions. The Survey Data & Participants reports displays survey results and the participants responding. The Export to CSV report allows you to export survey data that you can open and work with in programs such as Microsoft Excel.
The Process Overview Report provides details on each survey instance. This report does not provide details on survey results. This report displays information such as the date a survey became active, to the date the survey completed. To open the process overview report, click the Process Overview Report icon.
The Process Overview Report displays data for all instances of a survey application. At the top of the report is an overview bar that provides a summary of instance activity. You can see at a glance the total number of process instances, number of active instances, number of active tasks and instances that are in error. Escalations, which are not configured by default in application workflows, refer to instances that have uncompleted user tasks with reminders or expirations.
Instances Started: This is a chart that you can view in day, week or month blocks. This chart is helpful in determining trends for when users are starting surveys.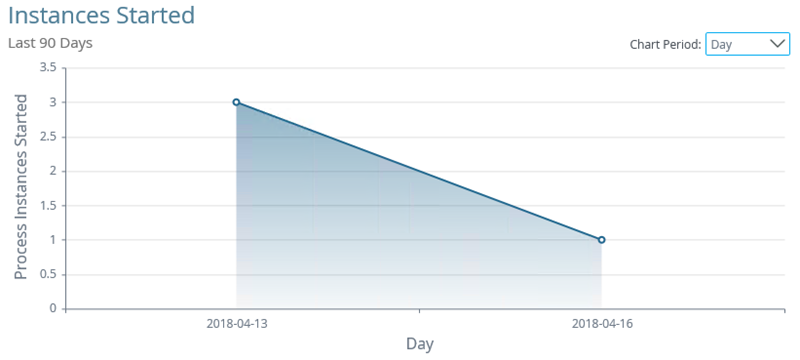
All Instances: This is a list view that provides data on all survey instances whether active, in error or complete. You can drill down into more detailed reports by clicking the ID link.
Activity Duration: This bar chart shows the average duration of the Complete Survey task. The Complete Survey task ends the survey and provides a cut-off date for survey responses.
Activities: This is a combination chart and spreadsheet that displays all the steps for the workflow. (Steps are also known as activities.) Surveys have only one task and that is for the survey owner to complete the survey, marking it completed and final. The Include System Activities box in the upper right corner adds system tasks to the left column in addition to the user tasks. In the upper left side of the report is a drop-down menu where you can select to view all, active or completed instances. After clicking the step name, the details appear in the central pane.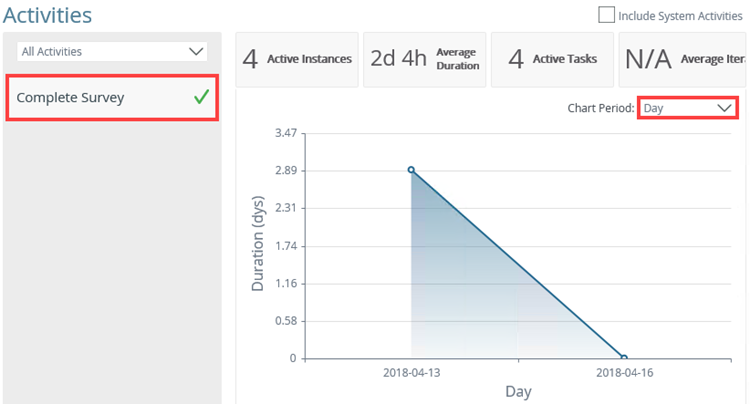
Related Processes (IPC): If a workflow instance has a sub-workflow associated with it, the sub-workflow appears in this section.
Process Instance Detail Report
From the All Instances report, you can drill down into the Process Instance Detail report. To launch this report, use the ID link for any instance.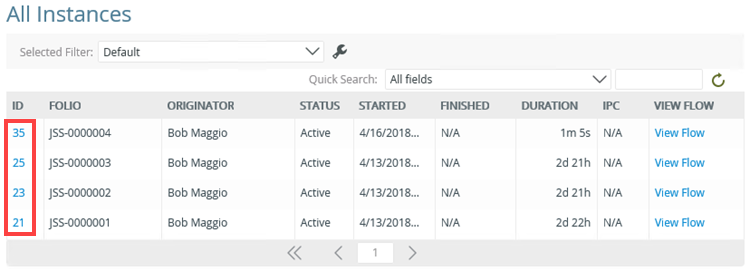
This report displays the Complete Survey activity details. In this report, you can see the current status of the survey and the start and end dates.
The Survey Data & Participants report displays survey responses and the users that submitted them. See Use Survey Apps for information on how to use this report.
This report allows you to export report data in a CSV (comma-separated values) format that you can open and work with in programs such as Microsoft Excel. By default, the report includes column names, however you can exclude those if you need to. You can also export data from all users (if you are sharing the application) or export your own data. This report includes both list data and system data (such as created by and created on).
Begin by clicking the Export to CSV icon.
Setting Filter Options
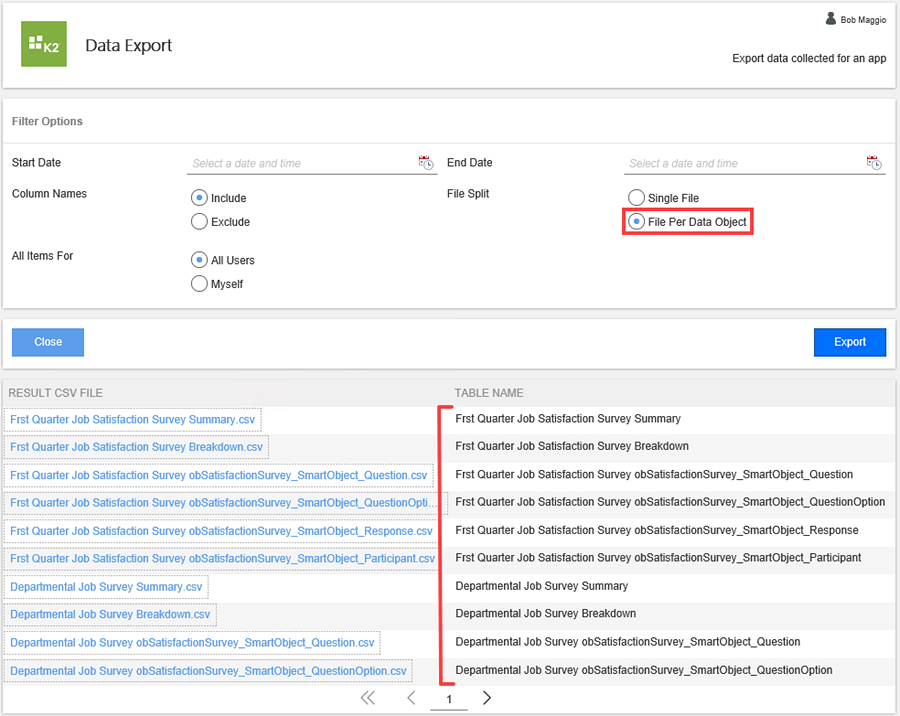
On the Data Export page, select the filter options you want to apply to your report.
| Filter | Options | Notes |
|---|---|---|
| Start Date | Select Date Select Time |
The start date applies to applications with workflows. For surveys, this is the date the survey began. |
| End Date | Select Date Select Time |
The end date applies to applications with workflows. For surveys, this is the date the survey ended. |
| Column Names | Include Exclude |
This report includes system data. Column names helps you distinguish one column from another. |
| File Split | Single File File Per Data Object |
Single File creates a single page report with separate sections for each data object associated with the list. File Per Data Object creates a separate report for each data object associated with the list. |
| All Items For | All Users Myself |
You can include list items created by all users or only yourself. |
The export data summary report

Exporting the Report
After setting filter options, click the Export button. You get a summary and a detailed report when choosing a Single File report. Click the report link to open it. Note that you must have software capable of reading CSV files to open the report.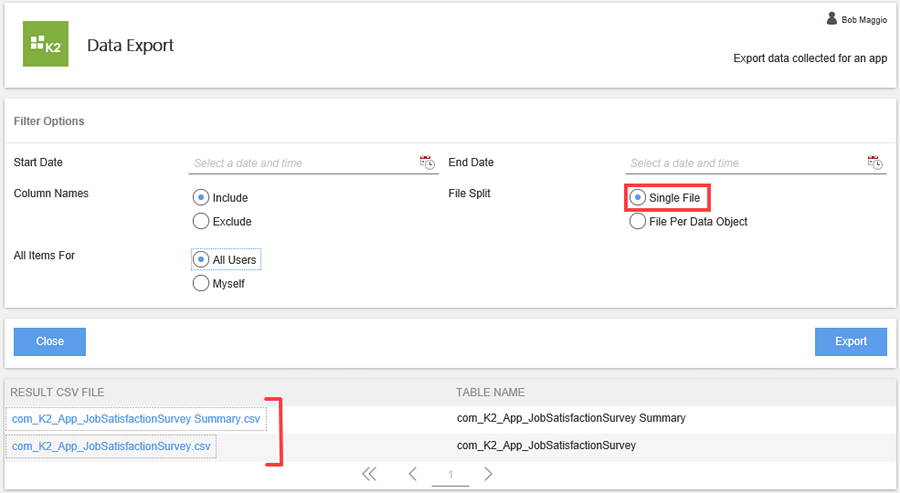
Multiple reports are generated when choosing the File Per Data Object report. Notice there are reports for all instances of the survey.