Report on Apps from the Catalog
This topic describes the reporting available for apps from the App Catalog. Reports allow you to view information on instances, activities, tasks, escalations, related processes and the view flow.
Images in this section may be different from what you see in your environment. Reporting on an app from the App Catalog depends on the specific app you are working with.
You open the Reports from the All apps landing page.
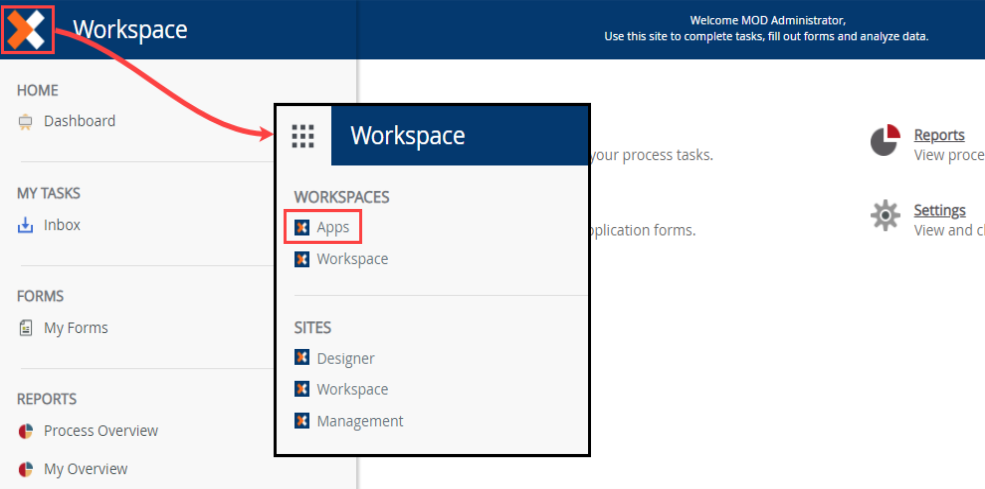
- From your Workspace, click the Logo and then from the Workspaces section, click Apps.

- On the Apps page, select the app from the All option in the Build section. Select the app and click Launch.

- On the app landing page, select the Reporting icon.
 You may not see the Administration icon. Only administrators of an app have access to this section.
The Process Overview Report displays data for all instances of an app. At the top of the report is an overview bar that provides a summary of instance activity. You can see at a glance the total number of process instances, number of active instances, number of active tasks and instances that are in error. Escalations refer to instances that have uncompleted user tasks with reminders or expirations.

Instances Started: This is a chart that you can view in day, week or month blocks. This chart is helpful in determining trends for when users are submitting requests.

All Instances: This is a list view that provides data on process instances whether active, in error or complete. This section is especially useful as you can drill down into more detailed reports by clicking the ID link. You can also launch the View Flow report for a single instance.

Activity Duration: This bar chart shows the average duration of task steps. If you have a workflow with many tasks steps, this report allows you to view which tasks are taking longer.

Activities: This is a combination chart and spreadsheet that displays all the steps for the workflow. (Steps are also known as activities.) By default, only user tasks appear in the left column. User tasks require human interaction of some kind, such as making a decision like Approve or Reject. The server performs system tasks behind-the-scenes, such as sending emails or updating content. The Include System Activities box in the upper right corner adds system tasks to the left column, in addition to the user tasks. In the upper left side of the page is a drop-down menu where you can select to view all, active or completed activities. After clicking the step name, the details appear in the central pane.

For additional information on the Process Overview Report accessed from Management, see the Process Overview Report topic.
Related Processes (IPC): If a workflow instance has a sub-workflow associated with it, the sub-workflow appears in this section.
From the All Instances report, you can drill down into the Process Instance Detail report. To launch this report, use the ID link for any instance. (If possible, use a completed instance.)

Notice the overview bar has similar statistics to the Process Overview Report bar.
In the Activities section, click the Review link to launch the Activity Instance Detail report.

From this report, locate the Participants section. Here, you can see who performed this task, the length of time it took to complete and the action decision made (known as the outcome).

Use the path at the top of the report to easily navigate the report.
Use the View Flow report to see the current status of a workflow instance and the path followed. It gives you a live, visual representation of your workflow and helps you to gain more insight into events that occurred during the workflow instance.
From the Process Overview Report in the All Instances section, click the View Flow link.

The View Flow shows.
