36. Report on the Expense Claim Application
In this last step, you look at some of the other reports K2 generates from workflow data. You view a Workflow Instances report, then launch the more detailed Activity Instances report. Finally, you open a View Flow report that displays a color-coded version of your workflow, with the colors representing the paths followed.
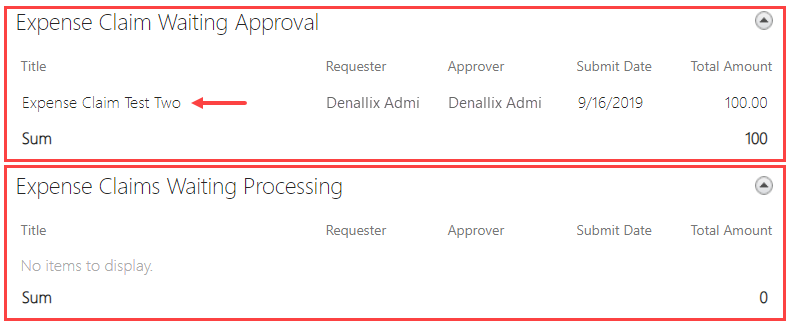
- Begin by opening the Expense Claim Reports dashboard. Recall that you built this report using controls found in the K2 Designer toolbox. Take a minute to review the two charts and two lists displaying workflow instance data. How many workflows are waiting for approval? How many are waiting for finance processing?
- Return to your SharePoint site or subsite collection landing page and open the Expense Claim Reports dashboard. Scroll down to the two reporting lists. How many workflows are waiting for approval? How many are waiting for finance processing? (There is one workflow waiting for approval - this is the claim you resubmitted. Because you just processed the second claim, there are no claims waiting for finance processing.)
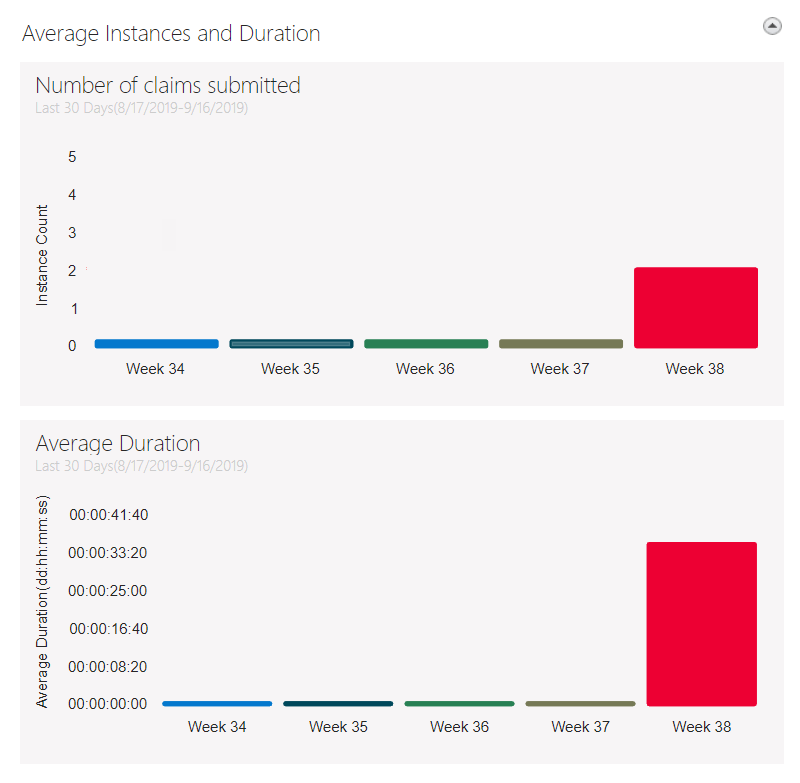
- Review the bar charts. Notice the Number of instances submitted is two. This is the number of claims you submitted. You can also get an idea of the average duration for the two claim submittals so far. At the moment, the charts are not very useful since you only have two instances to report on. Over time, you should see trends forming as you have more instances of this workflow started.
- Return to your SharePoint site or subsite collection landing page and open the Expense Claim Reports dashboard. Scroll down to the two reporting lists. How many workflows are waiting for approval? How many are waiting for finance processing? (There is one workflow waiting for approval - this is the claim you resubmitted. Because you just processed the second claim, there are no claims waiting for finance processing.)
- Next, take a look at the standard reports K2 generates using workflow instance data. Here, you can drill down into the reports to view more detailed content on each workflow instance, including data returned from task steps.
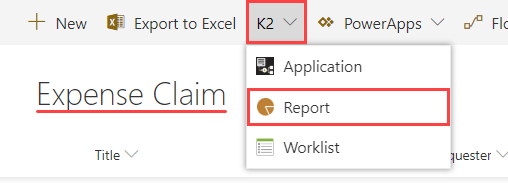
Open the Report page for the Expense Claim application. Click the Workflows bar chart to run the Workflow Instances report. This section displays a list of Expense Claim Workflows. Click one of the entries in the Workflow Instances report to run the Activity Instances report. The Activity Instances report displays a list of the task steps and their details for the selected workflow instance.- From the Expense Claim list landing page, click K2 > Report.
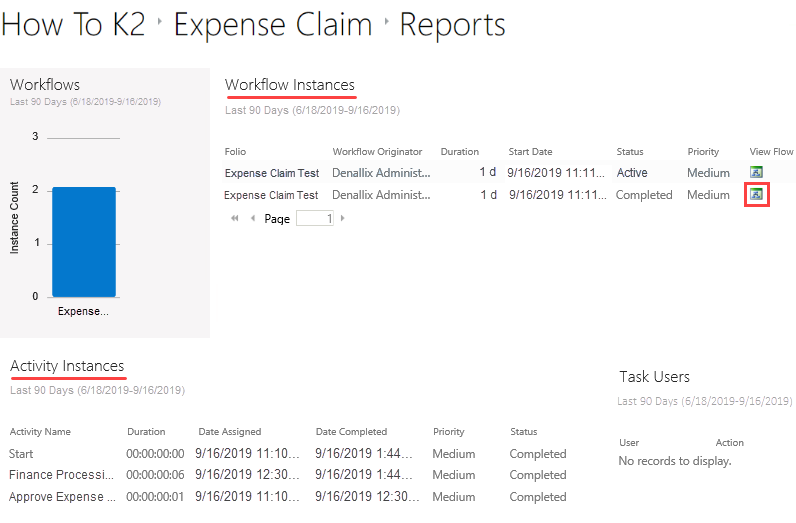
- Notice there is a bar chart that displays the number of workflow instances. This is very similar to the reporting controls you added to your report form. Click the bar chart. This runs the Workflow Instances report. Here, you see a list of each Expense Claim Workflow instances started. Notice that active and completed instances appear. Click the completed workflow instance row. This runs the Activity Instances report. Here, you see a list of task steps and their details.
- From the Expense Claim list landing page, click K2 > Report.
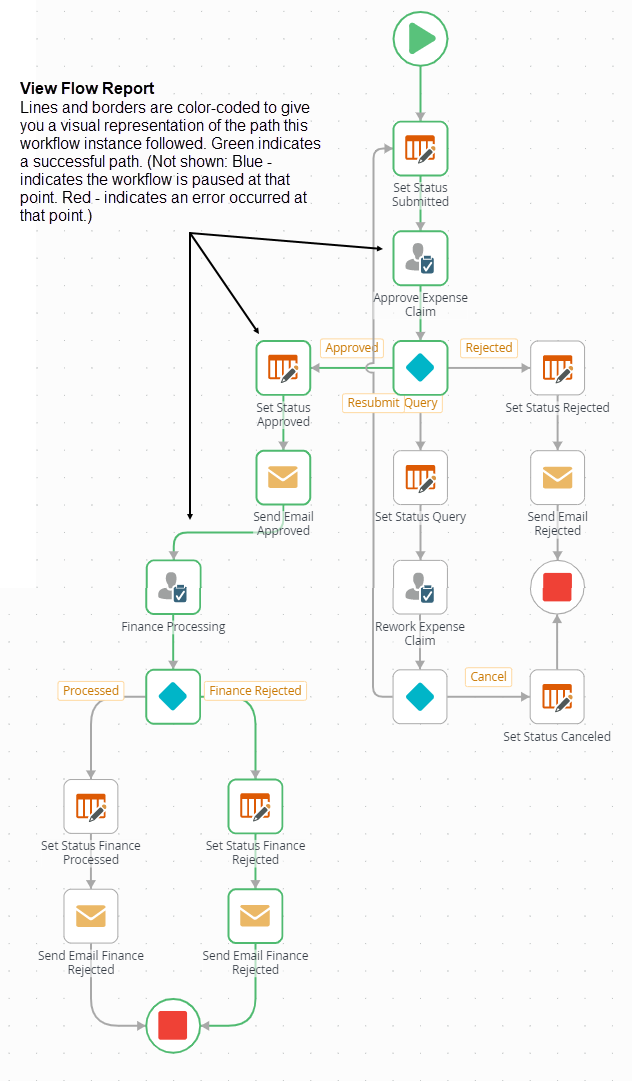
- Open the View Flow report for the completed workflow instance. The workflow has colored outcomes and borders now. Green represents the path of the workflow.
- Click the View Flow icon for the completed workflow instance. The View Flow chart renders your workflow with color-coded borders and outcomes. Green represents the path the workflow followed.
- Click the View Flow icon for the completed workflow instance. The View Flow chart renders your workflow with color-coded borders and outcomes. Green represents the path the workflow followed.
Review
In this step, you explored the reporting options for your applications. First, you reviewed the content found on the report dashboard, a custom reporting form you built from scratch. Second, you looked at the standard reports K2 offers and how you can "drill down" into deeper levels of detail, such as the View Flow report. In the next optional step, you learn how you can clean your environment by deleting artifacts no longer needed.