Map Time Labels
To help measure the significance of an event to optimize it accordingly, you can select the Time labels toggle button to display the time it took from one action/event to another in the Unified and Linear graph.
To display the time labels on a map:
-
Select the Process Library from the left navigation menu of the Nintex Process Discovery Console.
-
Choose the process from the list of available processes.
-
In the Map view, click the toggle button to select the Linear or Unified graph.
-
Click the toggle button to select Time labels
 .
.-
Time labels in the Linear graph:
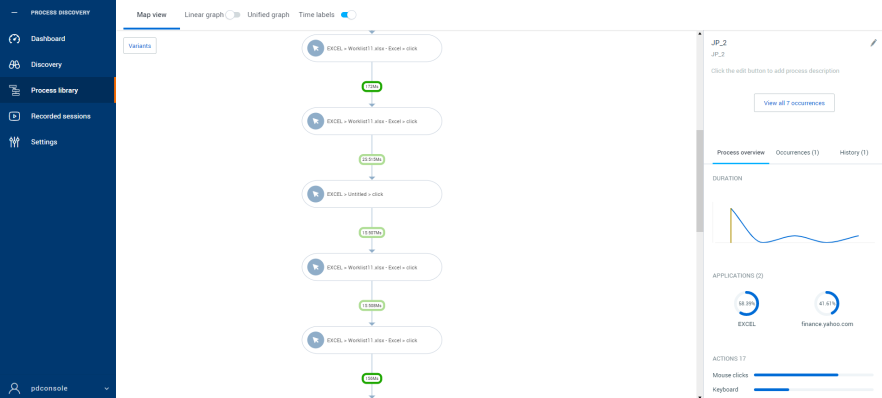
-
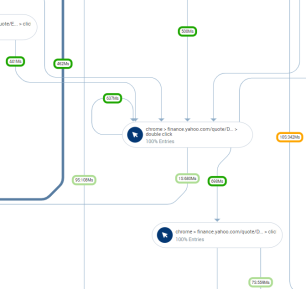
Time labels in the Unified graph:
The time shown reflects the median time, as there may be multiple repetitions of each flow.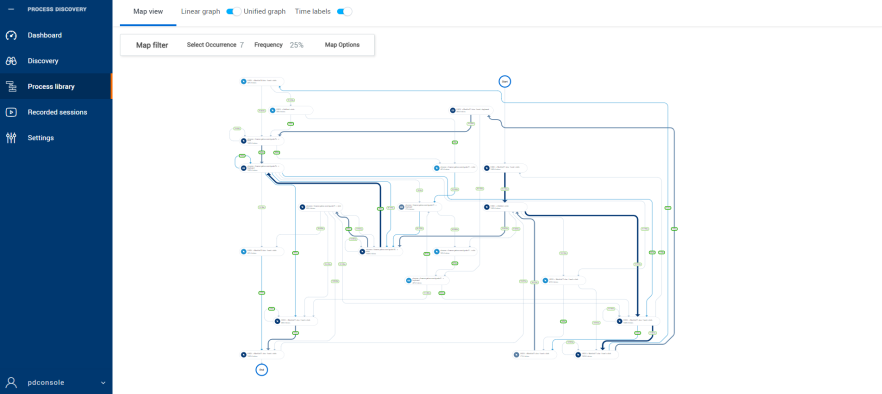
-
The time labels have color indicators to help you understand the events that take more time and can potentially be an area of optimization.
The color is defined in five levels by the length of the step:
-
Up to 1 second - Green
-
1 second - 10 second - Light green
-
10 second - 30 second - Orange
-
30 second - 2 minutes - Light Red
-
More than 2 minutes - Red