Troubleshooting and Debugging JSSP Code
There are several techniques and tools that help you when you're developing your code. You can write tests to execute the methods in your Service Type, see the template project in GitHub for an example of a test script. It's usually best to start with a tool like Postman to model out your requests. This gives you immediate feedback about the format of the API requests and the payloads that each method returns.
You can also output console messages in your code; see Console Output Methods for examples of supported methods.
You can set up and access console.log messages in your JSSP code as follows:
- Add console.log statements anywhere in your JavaScript code.
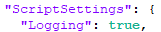
- Ensure Logging is set to true in the ScriptSettings section of the appsettings.json file of the JSSP host application, which can be found in the following folder on the machine where K2 was installed:
- C:\Program Files\K2\SourceCode.JsServiceProvider.Host
- C:\Program Files\K2\SourceCode.JsServiceProvider.Host
- Restart the K2 JavaScript Service Provider service if the value inside the appsettings.json was changed.

- Execute the JSSP JavaScript code that contains the console.log message either in Management or through the Designer.
- Access the K2 database of the K2 installation.
- Access the JsServiceProvider.ScriptLog table inside the database.
- Note that a new entry is added to the database table containing the message that was logged from the JavaScript code.
When writing the code for your Service Type, you can throw errors to surface the error to the product. You can throw an error with as much detail as you want to show in the product. As an example, the following line of code is located in the ELSE block of an IF that evaluates the status of the XHR requests:
Throw errors
throw new Error("Error: Request failed with status " + xhr.status + " Details: " + xhr.responseText);
This results in the following error in Management when executing a method that returns an unhandled error (HTTP response 400).
You can manually debug your JSSP JavaScript code by running the JavaScript code and stepping through the code as it executes. To achieve this, do the following:
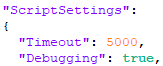
- Ensure Debugging is set to true and Timeout is increased from the default 5000 (else the JavaScript execution will timeout while debugging) in the ScriptSettings section of the appsettings.json file of the JSSP host application, which can be found in the following folder on the machine where K2 was installed:
- C:\Program Files\K2\SourceCode.JsServiceProvider.Host
- C:\Program Files\K2\SourceCode.JsServiceProvider.Host
- Restart the K2 JavaScript Service Provider service if the value inside the appsettings.json was changed.

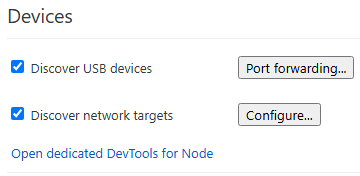
- Navigate to either chrome://inspect (in your Chrome browser) or edge://inspect (in your Edge browser).
- Click the Open dedicated DevTools for Node link.
- A separate browser DevTools window will open.
- Execute the JSSP JavaScript code that you want to debug either in Management or through the Designer.
- The opened browser DevTools window will pause execution on an initially breaking point.
- Resume script execution in the browser DevTools window.
- The browser DevTools window will pause execution at the beginning of your JSSP JavaScript code and you can now manually step through and debug the JavaScript code as necessary.
Console output methods
| Method | Notes |
|---|---|
| console.assert(assertion, message) | Logs a message if the assertion is false. e.g. console.assert(false, "this message is logged because the assertion is false"); |
| console.debug(message) | Outputs a debug level message e.g. console.debug("my message"); |
| console.error(message) | Outputs a error/exception level message e.g. console.error("my message"); |
| console.exception(message) | Same as the console.error() function e.g. same as console.error(message); |
| console.info(message) | Outputs a info level message e.g. console.info("my message"); |
| console.log(message) | Outputs a standard log message e.g. console.log("my message"); |
| console.warn(message) | Outputs a warning level message e.g. console.warn("my warning"); |