Monitoring workflow data involves defining a record-count threshold for Nintex content database tables that are in line with your business systems; enterprise systems can typically continue performing with higher record counts than small businesses.
A SharePoint Health Analyzer job will be scheduled to run weekly to scan the Nintex Content Database tables and perform a record count. If the table record count approaches 80% or exceeds the set threshold, users can manually access a warning that will appear in Central Administration > Monitoring > Health Analyzer > Review problems and solutions page under the Performance category.
Note: The severity (status) is updated on a weekly basis. Click Reanalyze Now to immediately update the severity.
Define table thresholds
The default threshold for each table is 10 million records, but this can be modified via NWAdmin ConfigureSettings operation.
Below are the thresholds for each table:
WorkflowInstance: 1000000
WorkflowProgress: 10000000
WorkflowLog: 5000000
WorkflowInstanceTasks, HumanWorkflowApprovers, HumanWorkflowApproversMetadata, HumanWorkflow, HumanWorkflowMapping, and DataStore: 50000
To edit the thresholds
Note: Users who perform this operation must have edit Nintex database permissions.
Copy the following xml snippet below and edit the table threshold to the desired number and save as NintexWorkflowSetup.xml to your computer, in this case we used the number 10000000 as an example.
3. Perform an iisreset and restart the SharePoint Timer server.
Alternative monitoring methods
Set up and use an alternative monitoring system such as System Center Operations Manager (SCOM).
Set up a SQL Server Agent Job to run queries on a regular basis that sends emails if the specified threshold is exceeded.
Manually run reports on a routine basis.
To manually run a report for record counts
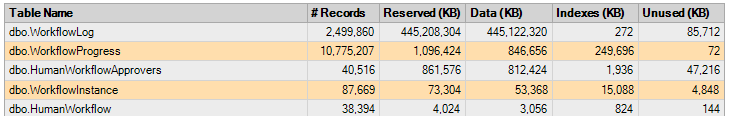
In (Undefined variable: BrandingThirdParty.Microsoft SQL Server Management Studio), right-click each NintexWorkflow content database and select Reports > Standard Reports > Disk Usage by Top Tables.
In the following report, the table dbo.WorkflowProgress contains over 10 million records. This large number of records may adversely affect performance in some environments. If errors or slow workflows were also occurring in this scenario, we would recommend purging select workflow data to reduce the record count of this table to below 10 million records if possible.
Note: Record counts that cause performance issues in some environments do not cause issues in others. Many environments with 100 million or more records run without issue. We recommend regularly monitoring your record count and then comparing the record count to your historical results if you start to notice performance issues. If you notice that your record count increased more than expected, it may be time to purge workflow data from the database to improve overall performance of workflows. For more information about purging workflow data, see Purge workflow data