Using View Flow
Use View Flow to see which step the workflow is currently on, who has participated in the workflow, drill down further into the workflow to view the activity data fields. The View Flow can be accessed from the Workflow Instance report as well as from the K2 Worklist menu.
When the View Flow icon is clicked the View Flow page will open with Workflow, Comments, Attachments, and Charts tabs.
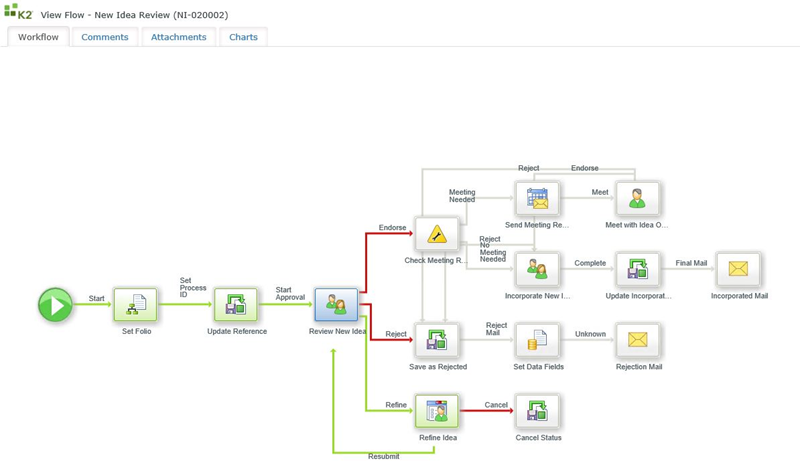
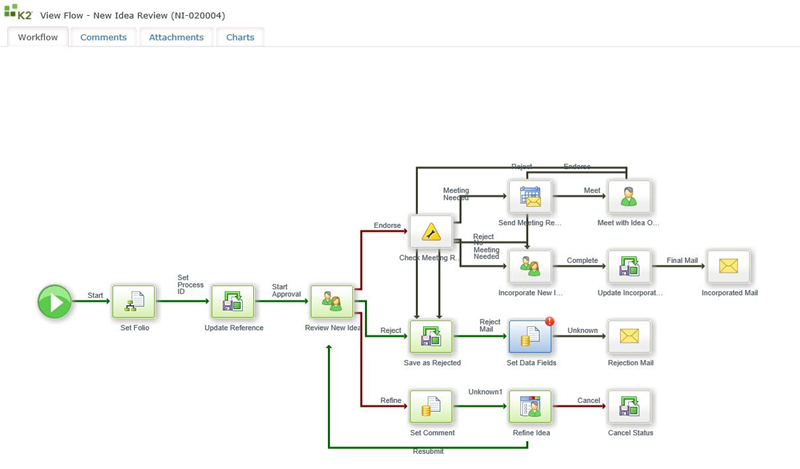
The workflow will be displayed in the body of the tab. Various colors and icons depict where in the process the workflow is. You can click on any of the steps or outcome lines to see more information.
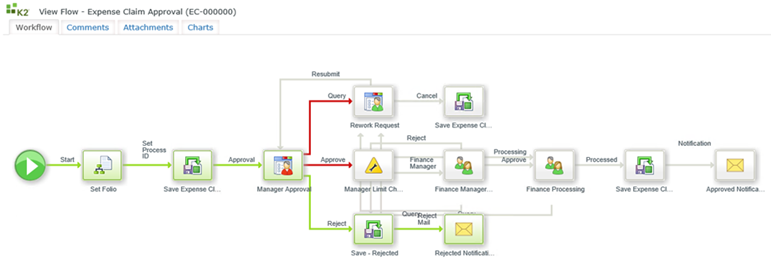
To interpret a View Flow diagram, remember:
- Line Rules that evaluated true and were successful are colored green
- Line Rules that evaluated false and were not successful are colored red
- Skipped lines or not yet evaluated lines remain clear
- Green workflow steps indicate that the step was successful
- Blue workflow steps indicate that the activity has started, and is in an Active or Running state
- White workflow steps indicate that the step has not yet been executed
- Blue events with red exclamation marks indicate that the event is currently in an error state
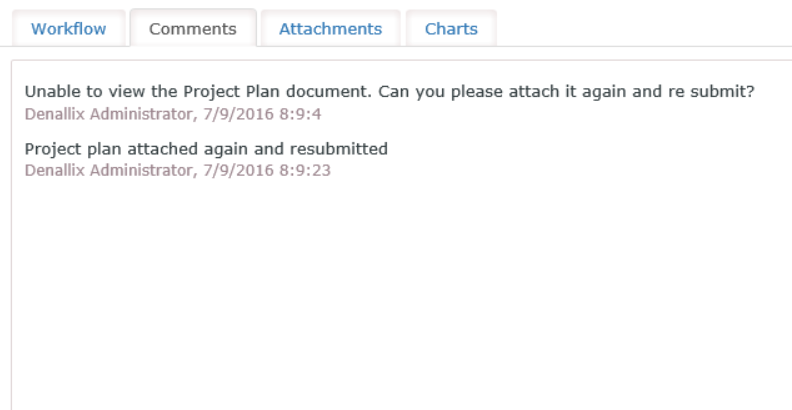
Process Instances of workflows that have Comments enabled will display the associated comments in this tab.
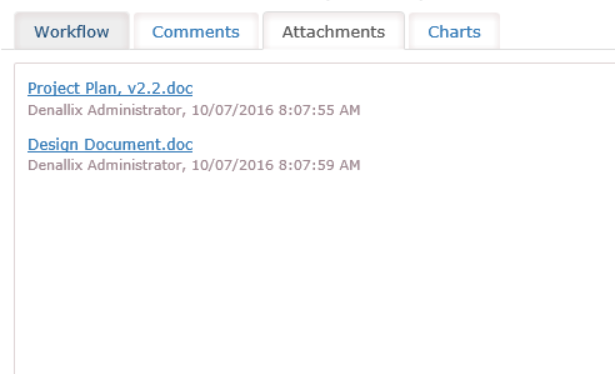
Process Instances of workflows that have Attachments enabled will display the associated attachments in this tab.
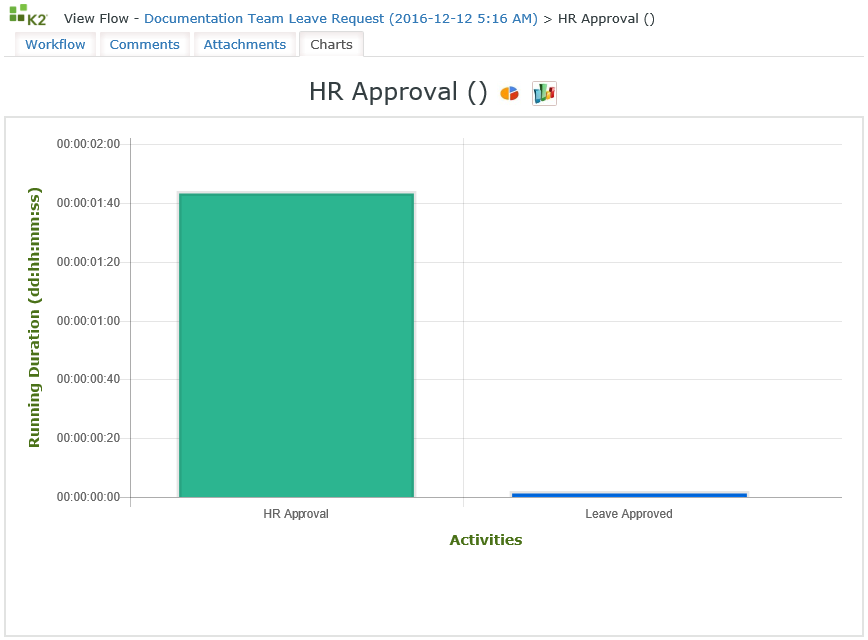
The Charts tab of the View Flow represents the activities in relation to each other graphically. The Pie Chart is opened by default. When hovering over an activity, the activity name is displayed with the running duration.
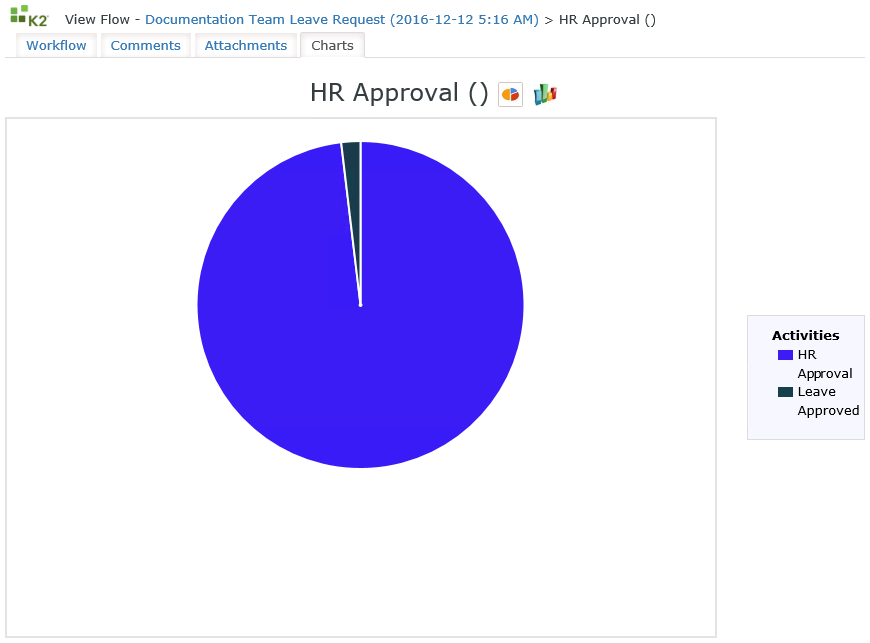
Click on the Bar Chart icon to open the Bar Chart. To return to the Pie Chart, simply click on the Pie Chart Icon.

|
Bar Chart icon |

|
Pie Chart Icon |
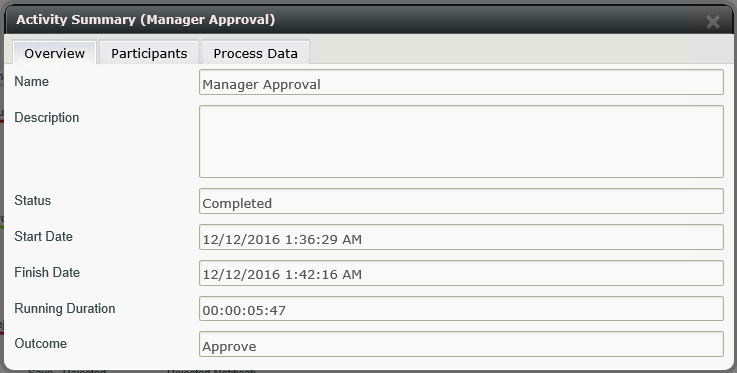
When clicking on the Activity within the Bar Chart or Pie Chart, the Activity Details dialog opens from where the Overview, Participants and Process Data can be selected. In the Pie Chart, the Activities in the box on the right can alternatively be clicked to open the Activity Details.
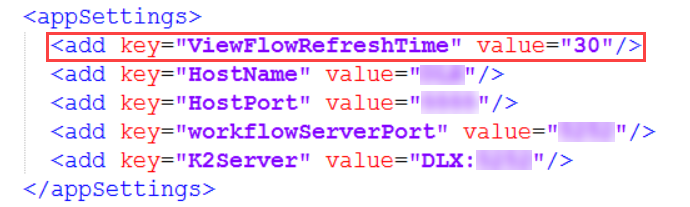
The Refresh interval can be changed in the web.config file by editing the value in the following node:
<add key="ViewFlowRefreshTime" value="30" />
The web.config file can be found in the following location:
"%ProgramFiles%\K2\WebServices\ViewFlow"
The value is recorded in seconds and the default value is 30 seconds. The Minimum value that can be applied is 15 seconds. If a 0 or -1 in entered, the value will default to 30.
You can customize the color of the activity blocks and lines that you see in the View Flow report by modifying its CSS.
To customize the color theme, edit the flow-colors.css file from the following location:
"%ProgramFiles%\ K2\ WebServices\ ViewFlow\ assets\ CSS"
Below is an example of the color theme customization:
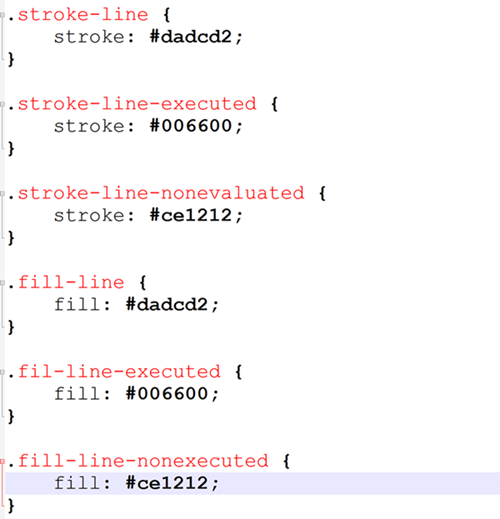
Default color theme:
Customized color theme:
You may see the following error when trying to see a process instance's view flow report: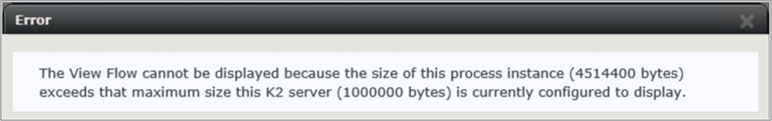 Error message: The View Flow cannot be displayed because the size of this process instance (4514400 bytes) exceeds the maximum size this K2 server (1000000 bytes) is currently configure to display.
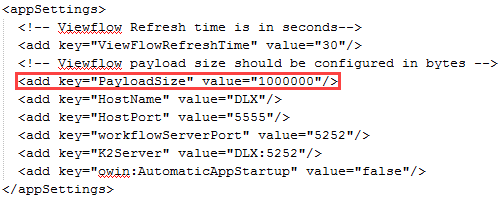
The default limit is set to prevent large process instances from impacting performance of the View Flow site. You can change this limit in the View Flow site's web.config file.To change the limit follow these steps: Open the View Flow site's web.config, found at the following location:
"%ProgramFiles%\K2\WebServices\ViewFlow\web.config"Open the view flow web.config and edit the PayloadSize value.
 Click Save.
You do not need to reset IIS or the K2 server after making this change.
Click Save.
You do not need to reset IIS or the K2 server after making this change.