User Overview Report
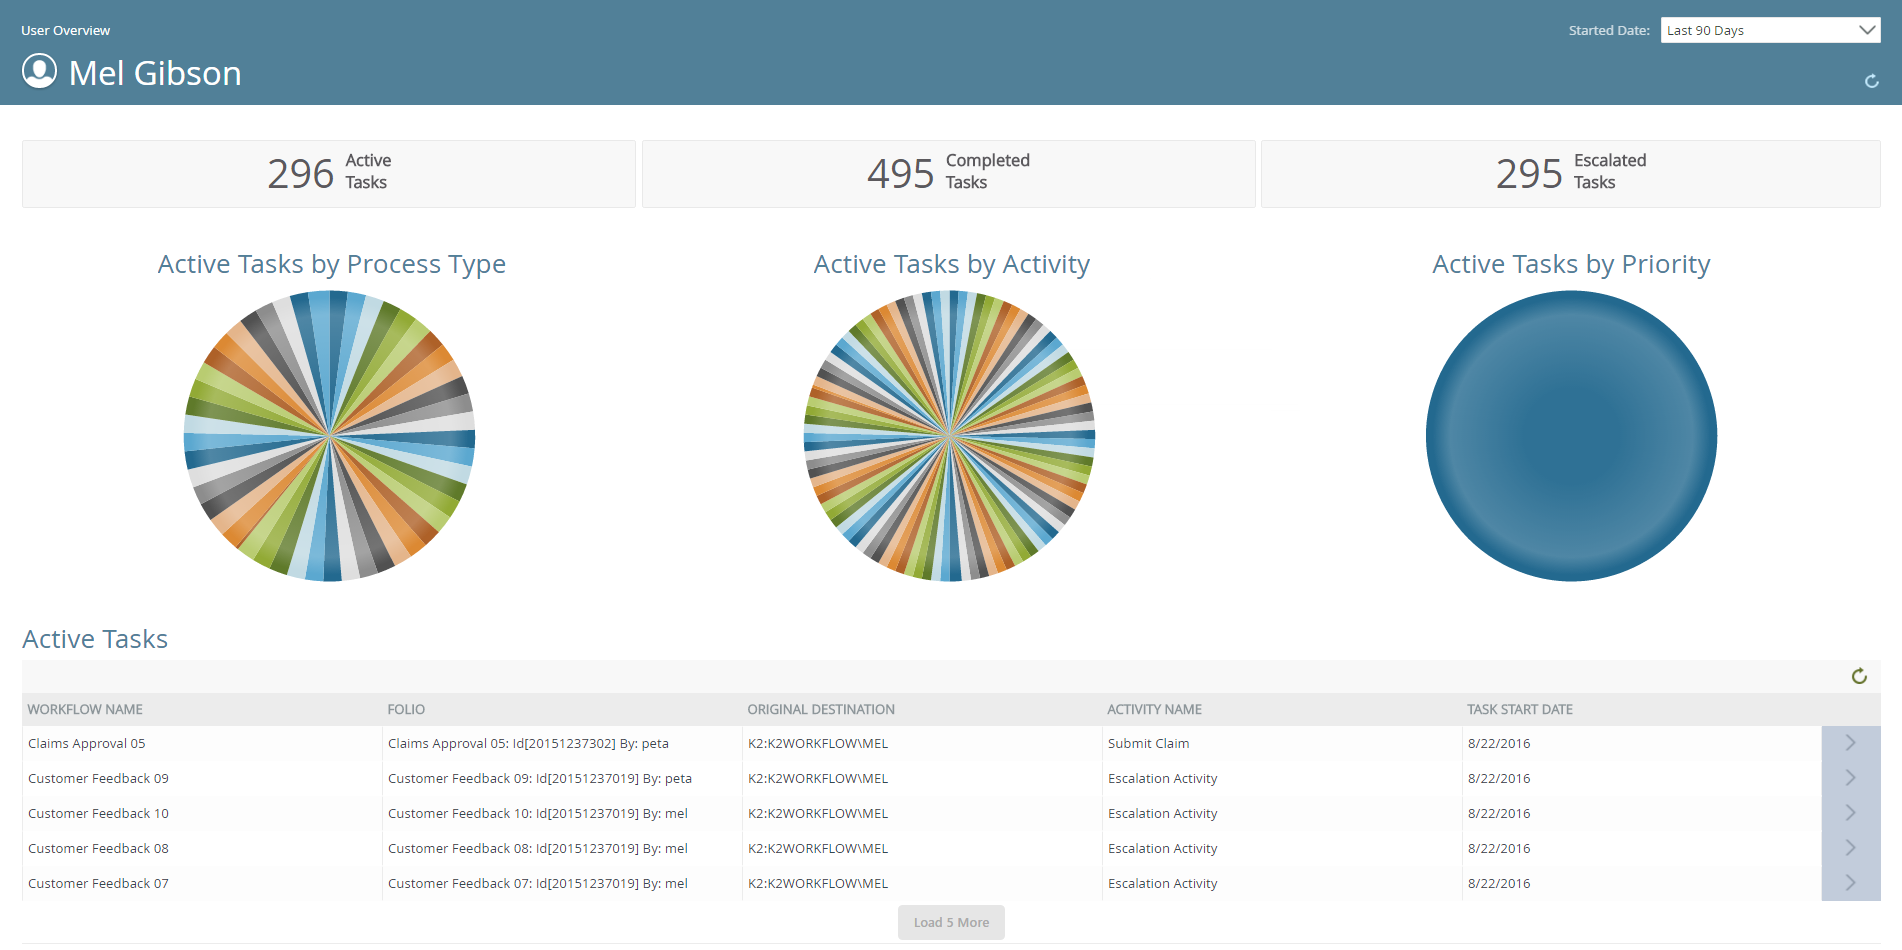
The User Overview report provides an overview of all active, assigned, completed, and escalated tasks for the current user.
To access the report, enter the following URL in a browser:
[Server]/Report/UserOverview
Enter your credentials and the report opens. The report can be accessed by any user to view an overview of their tasks.
Examples of why to use this report:
- Allows you to view your active, completed and escalated tasks.
- Allow you to view the amount of tasks you have assigned and action them.
- Allows you to view the average duration it took you to complete a task.
- Allows you to view the duration of a specific activity within a task.
Example
This section provides an example of the User Overview report.
| Field | Description |
|---|---|
| Started Date | Allows you to the configure the report by specifying which data is returned. By selecting a preset time period such as the last 90 days, last year, today, and yesterday. |
| Overview Bar | Displays a summary of all active, completed and escalated tasks. |
| Active Tasks by Process Type | Displays a pie chart of all active tasks by process type. Hovering over a section of the pie chart, displays information about the amount of active tasks for a specific process.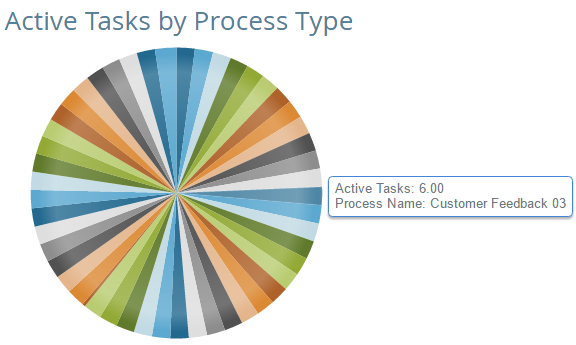 |
| Active Tasks by Activity | Displays a pie chart of all active tasks by activity. Hovering over a section of the pie chart, displays information about the amount of active tasks for a specific activity.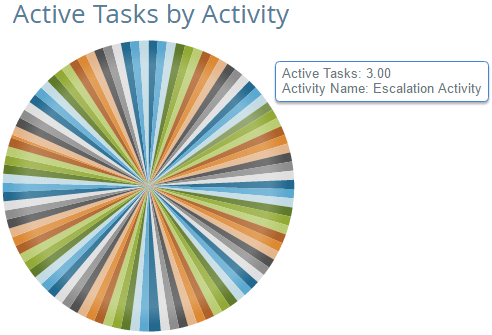 |
| Active Tasks by Priority | Displays a pie chart of all active tasks by priority. Hovering over a section of the pie chart, displays information about the amount of active tasks by a specific priority.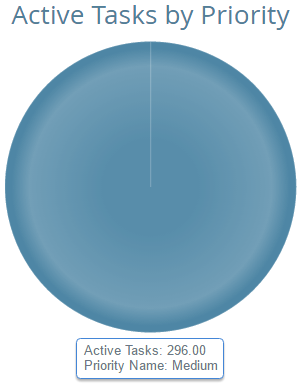 |
| Active Tasks | Displays all active tasks. Each task is displayed by Workflow Name, Folio, Original Destination, Activity Name and Task Start Date. |
| Assigned Tasks | Displays a line graph of assigned tasks over a period of time, which are filterable by day, week and month. |
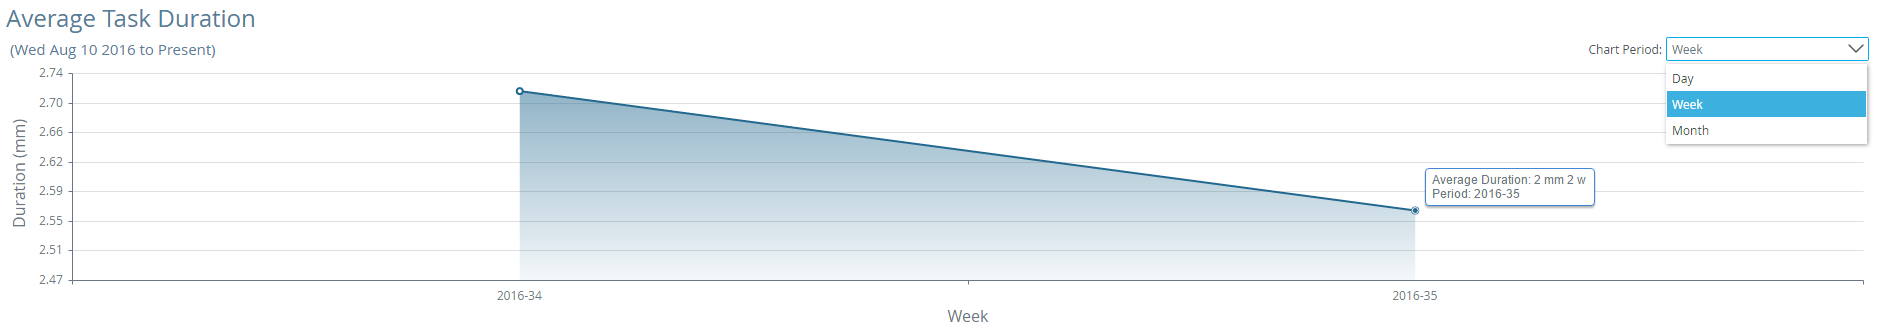
| Average Task Duration | Displays a line graph of the average time taken to complete a task in minutes and can be filtered by day, week and month. |
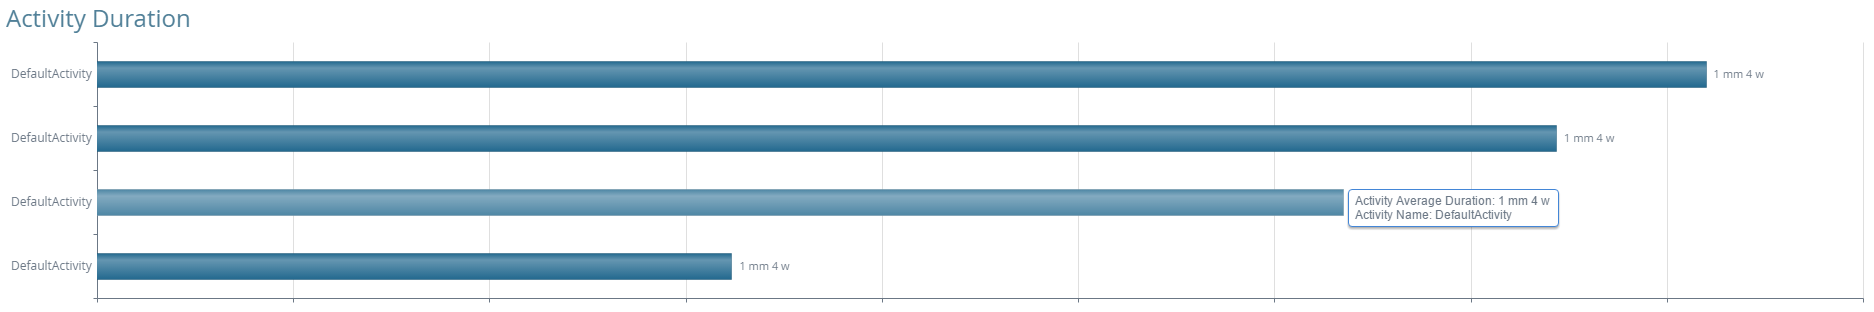
| Activity Duration | Displays the duration of each activity the user actioned in minutes across all processes in a bar graph configuration. |
The following sections are available in the User Overview report:
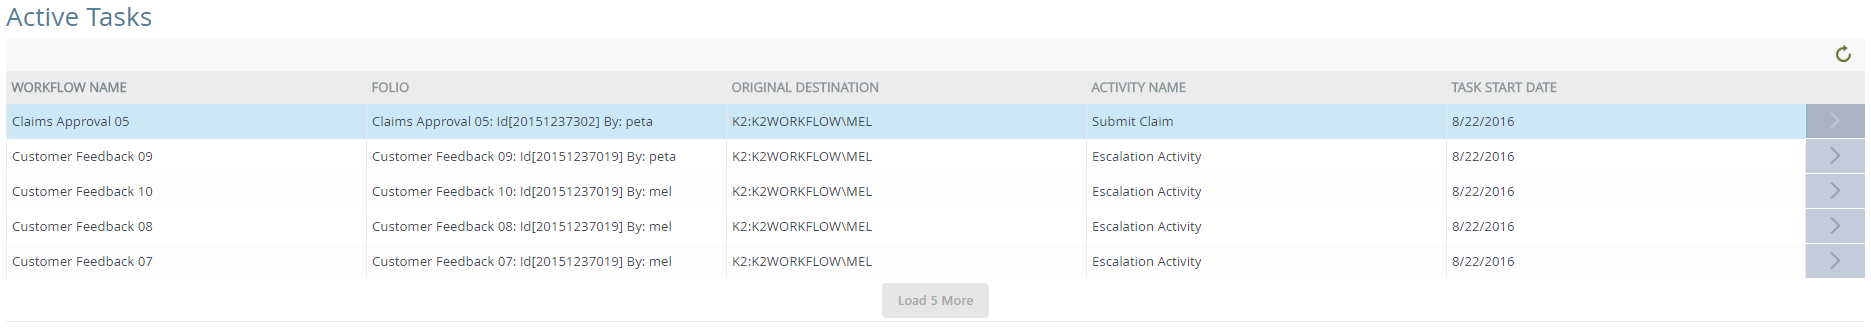
The Active Tasks section displays all active tasks for the current user. Each task is displayed by Workflow Name, Folio, Original Destination, Activity Name and Task Start Date, and is sortable by clicking the required column name.
By default, only five tasks are displayed in the Active Tasks section. Click the Load 5 More button to see more tasks.
The following actions are available on the Active Tasks section:
- Open the task form
- Action a task
- View the task's View Flow report
- Release, sleep, redirect, and share a task
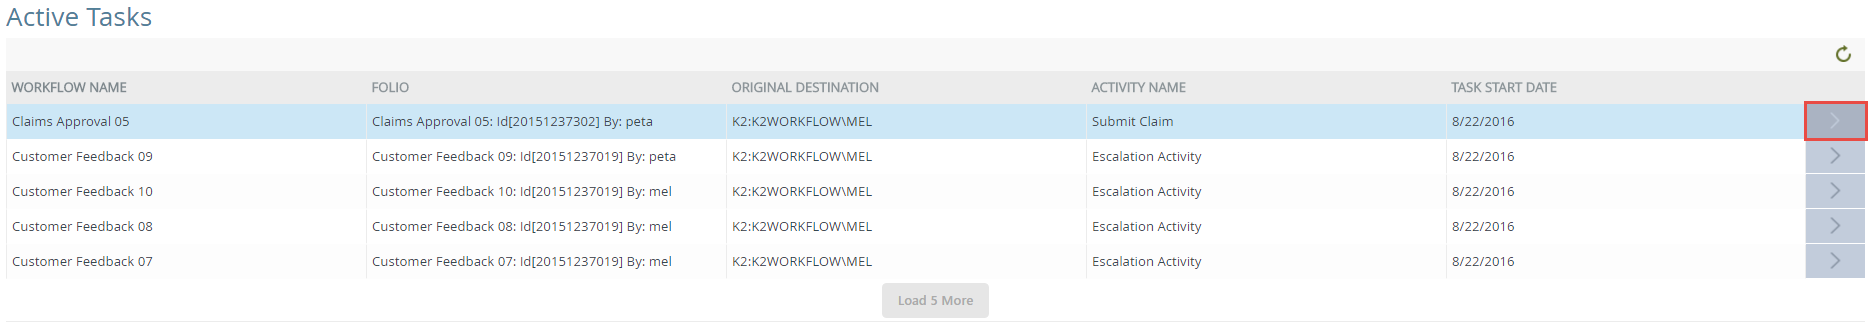
The following steps detail how to open a task form on the Active Tasks section:
- On the Active Tasks section, click the Action Menu button.
- Click Open Form.
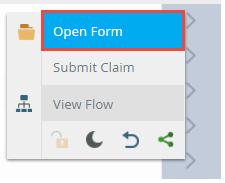
- The form opens in a new tab.
The following steps detail how to action a task on the Active Tasks section:
- On the Active Tasks section, click the Action Menu button.
- Select the required outcome to action the task.
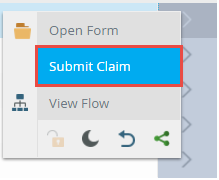
- The task is actioned and removed from Active Tasks section.
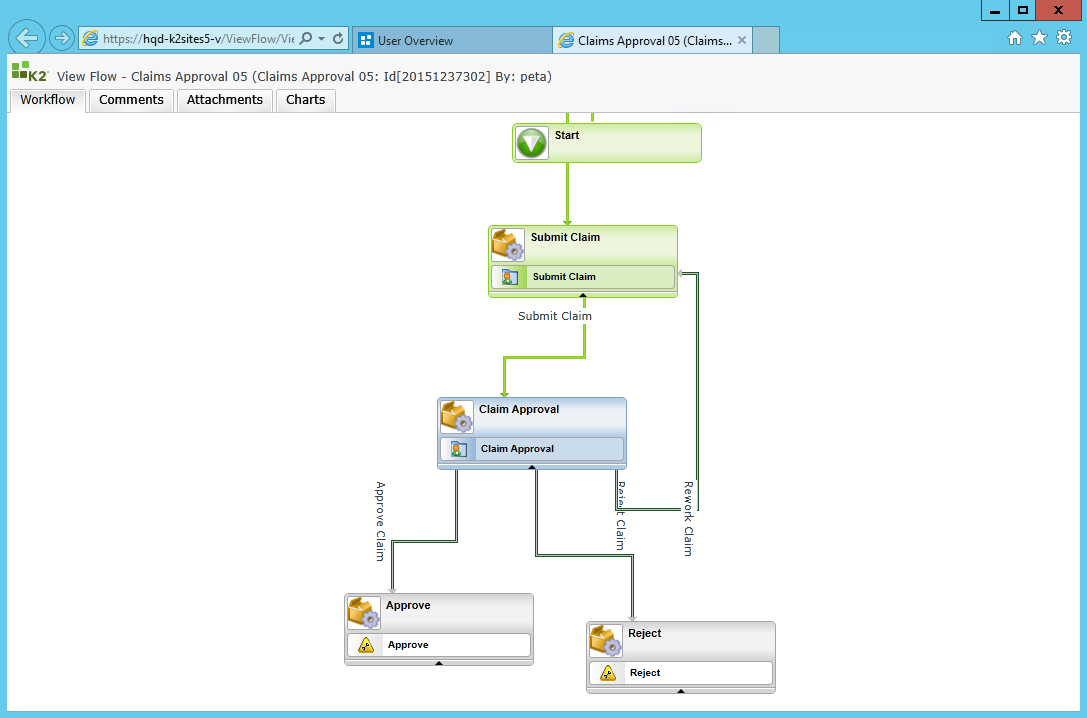
The following steps discuss how to view a task's View Flow report on the Active Tasks section:
- On the Active Tasks section, click the Action Menu button.
- Click View Flow.
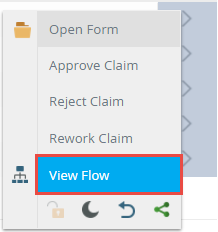
- The tasks View Flow opens in a new browser tab. For more information on how to use the View Flow, see the View Flow topic.
The Release option can only be used on task with an "Open" status. When you open a task, you take one of the available slots for that task. Suppose a task is allocated to two users, Bob and Alice, and there is only one slot available for that task. As soon as Bob opens the task, the task's status changes to Open for Bob and Allocated for Alice, and Alice cannot open the task because there was only one available slot. Releasing the worklist item resets the item's status back to Available so that either Bob or Alice can open and action the task.
Follow these steps to release a task:
- On the Active Tasks section, click the Action Menu button.
- Click the Release(Lock) icon.
- The Task is released.
You can delay acting on a task in the Active Tasks section until a later date. Choose to delay acting on a task until a preselected time (Basic) or a date that you specify (Date) occurs. For example, if your schedule prevents you from completing tasks until the next day, you can choose to delay your action until the following morning or afternoon.
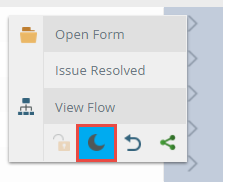
Follow these steps to sleep a task:
- On the Active Tasks section, select a task and click the Action Menu button.
- Click the Sleep icon.
- On the Sleep page two options are available, Basic and Date. To set up a Basic sleep option, click the Basic radio button followed by the radio button for your selected basic option.
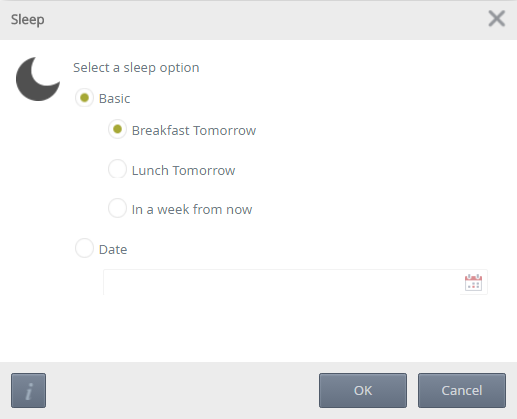
Where:- Breakfast tomorrow – The task is paused until 8 AM the following day.
- Lunch tomorrow – The task is paused until 1 PM the following day.
- In a week from now – The task is paused until 8 AM the following week.
-
To set up a custom date sleep option, click the Date radio button and enter a date in the Wake Date box or click the calendar icon to select a date.
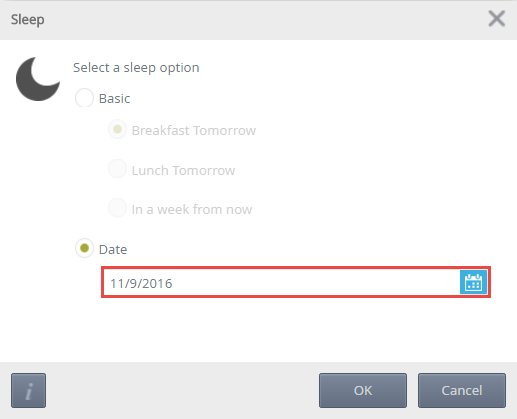
- Click OK.
Redirecting a task means that you move an item from your task list to another user's task list. Think of this as assigning that task to another user.
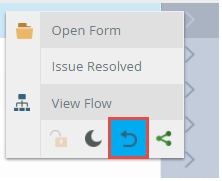
Follow these steps to redirect a task:
- On the Active Tasks section, select a task and click the Action Menu button.
- Click the Redirect icon.
- On the Redirect page, enter a user in Search box to redirect the task to.
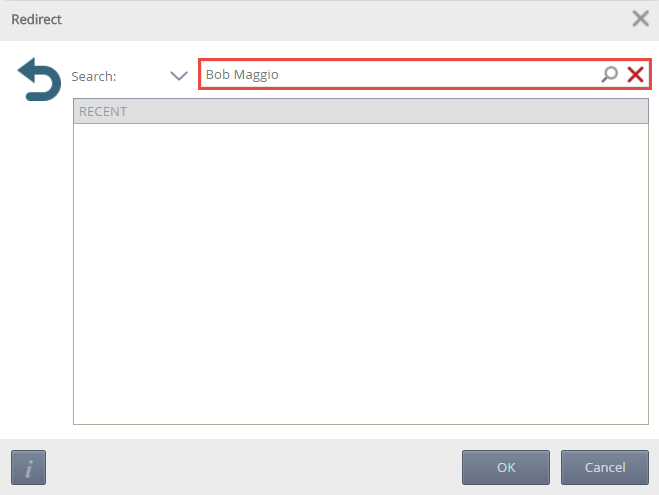
- For detailed search options, click the drop-down arrow. Select an option from the Match and Security Label and click the Search icon.

- Select a user from the search results and click OK.
- The user chosen receives an email notification informing them the task has been redirected to them.
Sharing a task means that you allow another user (in addition to you) to action the task . Think of this as creating a copy of a task so that either you or the other user can action the task.
Follow these steps to share a task:
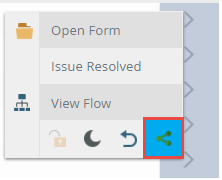
- On the Active Tasks section, select a task and click the Action Menu button.
- Click the Share icon.
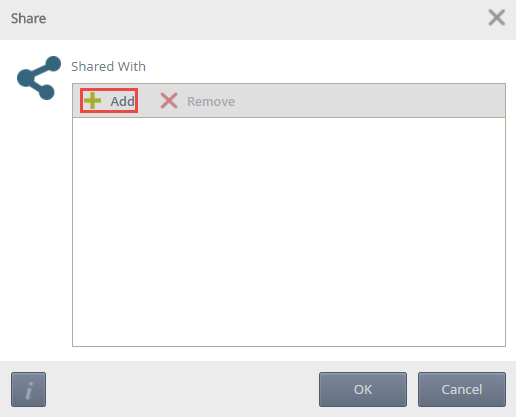
- On the Share page, click the Add icon.
- On the Add User page, search for the required user. Detailed search options are available such as specifying a
Match and Security Label via the drop-down.
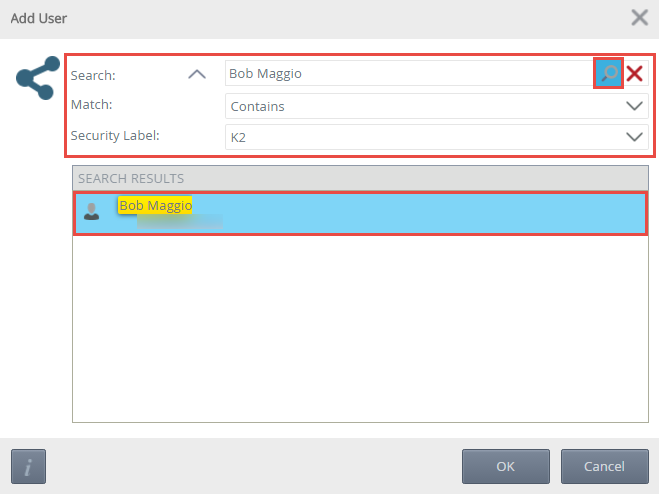
- Select the user from the search results and click OK.
- Click OK on the Share page.
- The user receives an email notification informing them the task has been shared with them.
The Assigned Tasks section displays a line graph of all assigned tasks over a specified period. The data returned is set by the Started Date option. Hovering over a point on the line graph displays data by assigned tasks count and period. The returned data can be filtered by the Chart Period drop-down by day, week and month.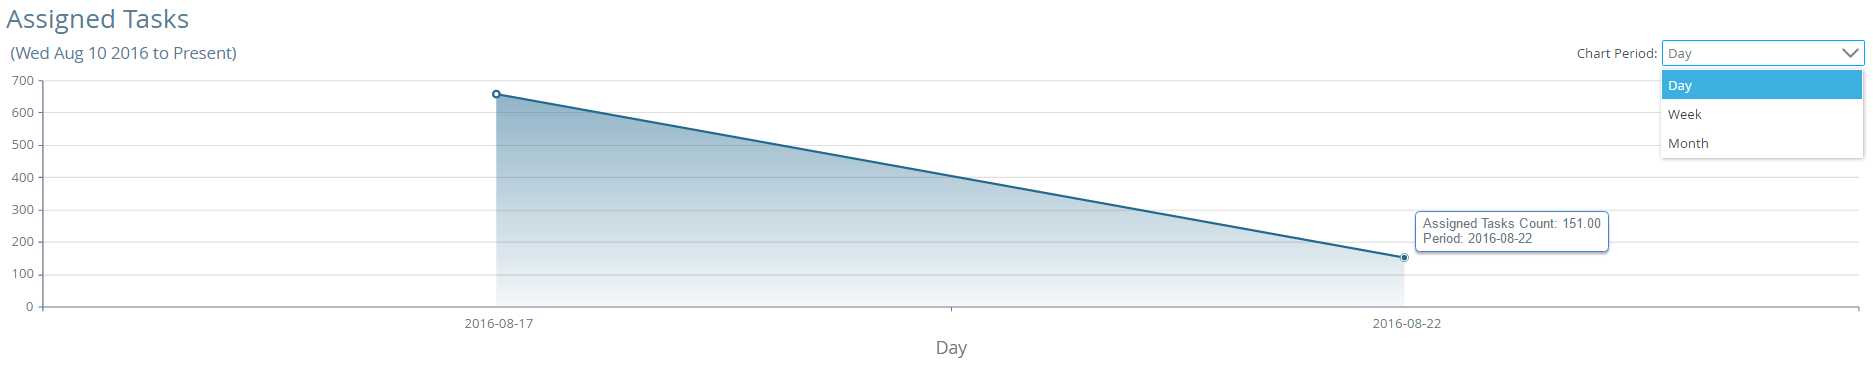
The Average Task Duration section displays a line graph of the average time taken to complete a task over a specified period. Hovering over a point on the line graph displays data by average duration and period. The data returned is set by the Started Date option. The returned data can be filtered by the Chart Period drop-down by day, week and month.
The Activity Duration section displays the duration of each activity you actioned across all tasks in a horizontal bar graph configuration. Hovering over an activity on the bar graph displays data by activity average duration and activity name.
Permissions
To view and action tasks on the User Overview report, you must have Process Administrator rights.
To set Process Administrator rights, see the Process Rights topic.
Using the Report
The section below discusses how to use the report, such as configuring the report via the Started Date drop-down, creating filters and using the Quick Search.
Using the Started Date drop-down
The Started Date drop-down allows you to configure the dates of the report. Selecting an option from the Started Date refreshes the report. The report can also be refreshed using the icon. The Started Date options are determined by the culture settings in the browser settings.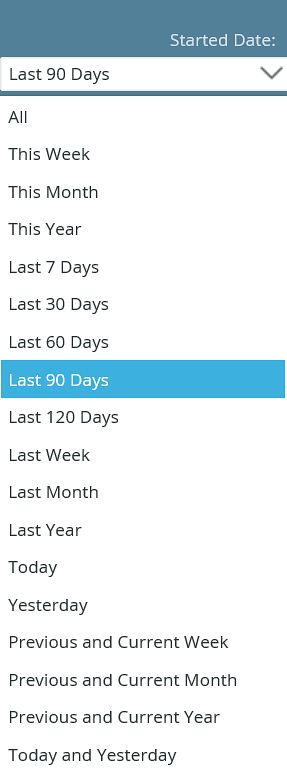
Using the Chart Period
The Chart Period drop-down allows you to further filter returned data by day, week and month.
Follow the steps below user the Chart Period:
- On the report section where the Chart Period is available, click the Chart Period drop-down and select an option.
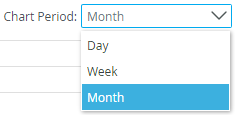
- The report section will refresh with data from the selected Chart Period filter option.
Considerations
Below are considerations when using the User Overview report.
- Editing the color and graph types of the report is not currently possible.
- Exporting the report to Excel and PDF is not currently possible.
- There is no Design Time for this report.