Troubleshooting and Debugging Custom Service Brokers
Troubleshooting custom Service Brokers can be challenging, but if you use the available mechanisms and tools to debug and log Service Brokers you should be able to resolve most problems quickly.
The most important point to understand before you start troubleshooting a Broker is how the communication flows from the Consumer through the SmartObject API's to the K2 Server, from there to the Service Object/Service Instance and then into the Service Broker code and finally into the Provider through the provider's API. If you are having trouble with a SmartObject, try to narrow down the problem by excluding layers from this communication path. For example, if a workflow encounters an error while executing a SmartObject method, run the same SmartObject method with the SmartObject Tester utility to exclude the workflow as a source of the problem. If the SmartObject Tester fails with the same problem you know that the problem is not in the workflow.
When troubleshooting service brokers, use the available Logging and Debugging approaches to isolate the cause of the problem.
Logging
SmartObject Runtime Logging
To set up logging for SmartObjects, edit the file "%PROGRAMFILES%\K2\Host Server\Bin\K2HostServer.exe.Config". (In versions of K2 prior to 4.6.9, SmartObject runtime logging is configured in the file "[Program Files](x86)\K2\Host Server\Bin\SourceCode.SmartObjects.Runtime.config"). Then configure the <sourcecode.smartobjects.runtime><logging> section to set up which logging you want to output (use the table below for reference). By default, all the log files are disabled, so change the log="no" setting to log="yes" for each logfile you want to create. Restart the K2 service to pick up the configuration changes, execute the SmartObject method and then review the log files' output. By default, the log files are written to "%PROGRAMFILES%\K2\ServiceBroker\logs"
There are five different log files:
| File Name | Logged Information |
|---|---|
| brokerpackagein.log | Logs the SmartObject that called the broker and the method of the SmartObject that uses the Broker. This information is useful to see which SmartObject and method were executed, when. |
| brokerpackageout.log | Only contains a number of records that were returned by the broker. This data can be useful when you need to troubleshoot why not the number of expected records was returned to the UI. For example: if the brokerpackage reports the correct number of expected records, perhaps the UI is filtering out data after the broker returned the right number of records |
| serviceauth.log | Shows the security credentials used when the service was executed. Check the current thread user to see which user account executed the service broker code. |
| servicepackagein.log | Represents the Service Instance configuration, the Service Objects for the Service Instance that were called along with their Methods and Properties, the Mappings that define how the Provider Types are mapped to Service Object Types. When troubleshooting, one of the most useful values is probably the <serviceauthentication> section, where you can see the user account context that was used to query the provider. |
| servicepackageout.log | Is the "raw" data returned by the Service Instance. This information can be useful when the data which eventually surfaces to the UI does not match the data you were expecting. Check this log file to see if the expected data was returned to the SmartObject, in which case the problem is likely on the UI side. |
Host Server Logging
To configure Host Server logging, modify the file "%PROGRAMFILES%\K2\Host Server\Bin\HostServerLogging.config" and set up the required log target and log level settings to output logging information. In practice, there is limited information specific to SmartObject execution which is output in the Host Server log files, but these files are useful especially for authentication issues and when to identify which users connected to the K2 server before a SmartObject method is called.
Host Server Console Mode
Running the K2 Service in console mode is a nice way to track connections and SmartObject execution calls at runtime. As with Host Server Logging, the output to the console with the actual SmartObject execution data is limited, but it is a nice way of troubleshooting connection issues since you can see in real time when users are connecting to the K2 server and when they are executing SmartObject methods. To start K2 in console mode, stop the K2 Windows Service and then launch console mode with the K2 Server (Service Account) shortcut on the Start Menu.
We recommend starting the K2 Console in the context of the K2 Service Account to preserve the same credentials that are used when the K2 service runs as a windows service. This will help to prevent false issues, since the user context is the same for both Console and Service modes.
Console.Writeline("");
statements to your custom code, the output will be shown in the Host Server console window.
Windows Event Log
The windows event log is a useful logging option. You can configure the Host Server Logging file to output information to the Windows Event log (just enable the <LogLocation Name="EventLogExtension" Active="True" LogLevel="Error" />in the host server logging configuration file ("%PROGRAMFILES%\K2\Host Server\Bin\HostServerLogging.config") to output log information to the Windows Event Log. Furthermore, the windows event log can also expose logging information regarding network connections, authentication issues, underlying O/S issues and more.
Provider Logging and Tracing
Finally, don’t forget about the logging and tracing available in the Provider. The actual logging depends on the provider, of course, but this is a good way to determine whether the expected user credentials and query data are being sent to the provider by K2.
Debugging
To debug a custom Service Broker you will need the Service Broker source code. The debugging process is similar to debugging an ASP.NET solution hosted on an IIS server: the key lies in connecting to a process on the K2 server since the code is being executed by that process.
Debugging is a simple 4-step procedure:
1) Open the Service Broker source code in Visual Studio and add breakpoints
You'll need the Broker Source Code to debug the code, and you'll need to add some breakpoints to the code.
DescribeSchema() is the entry point when the Service Instance is Registered or Refreshed, so if you have a problem when registering a Service Instance, add a breakpoint to the first line of the DescribeSchema() method.
Execute() is the entry point whenever the Service Broker is called by a SmartObject at runtime, so if you are trying to resolve a runtime error, add a breakpoint to the first line of the Execute() method.
2) Deploy the Service Broker .dll AND .pdb files to the K2 Server
Build the project in Debug mode and then copy the resulting .dll and .pdb file to the K2 Host Server's ServiceBroker directory. You may need to stop the K2 Service before doing to copy since the .dll file may be in-use from previous executions.
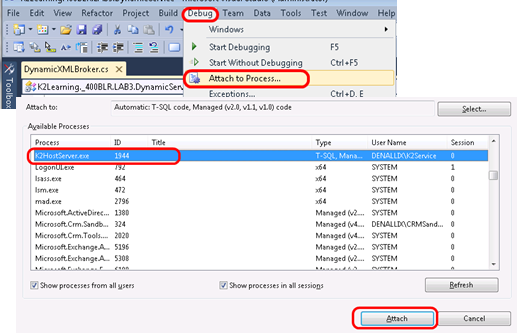
3) Attach to the K2HostServer.exe process
In Visual Studio, use the Debug | Attach to process… menu to attach to the K2HostServer.exe process on the K2 Server.
Attaching to the K2HostServer.exe process:
4) Execute the SmartObject and Service Instance methods to "hit" the breakpoint
Finally, you should be able to "hit" the breakpoint in your code by registering/updating a Service Instance for the Service Broker or by executing a SmartObject which uses the Broker. You should see that Visual Studio identifies the breakpoint and then you can start stepping through the code, debugging it as you would any other .NET code.
We also do not recommend that you use this debug-attach method in a production environment, unless downtime has been scheduled.