Create Report - Data layout: Row grouping
The Data Layout: Row grouping screen creates the report columns by dragging the relevant SmartObject properties onto the design canvas where it says DROP HERE. This will add those fields to the report as shown below. The Data layout: Row grouping screen is only applicable to the Matrix and Summary Reports and forms part of the third step in the Create Report Wizard.
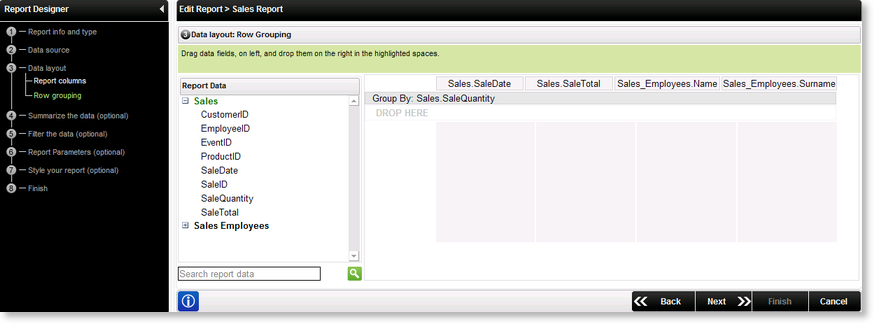
Fig. 1. Report Wizard steps 3 -Data layout: Row grouping
| Feature | What it is | How to use th |
|---|---|---|
| Report Data | Lists the SmartObject properties selected for the report | Drag the SmartObject property onto the design canvas as report row groupings |
| Design Canvas | The design canvas displays the layout of the report with highlighted areas where SmartObject properties are dropped to create the rows for the report. The row name consists of the SmartObject followed by the property name. | Drag a SmartObject property from the Report Data section and drop it in the DROP HERE area to create the row groupings headings for the report |
| Search Report Data | A Property can be found by using the search field. | Enter the name or first letter of the Property in the search text box |
Configuring the Row grouping
A row in a report can be deleted by clicking the down facing arrow next to the row name and selecting Delete as shown below
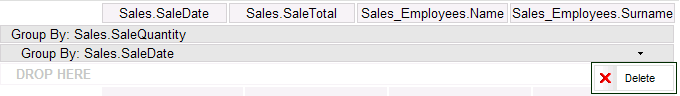
Fig. 2. Deleting a Row grouping
