K2 Process Portals - Process Statistics Report Parameters
The Parameters screen is accessed by selecting the Parameters tab on the Configuration screen. The Report Parameters defines what the report should display and in what format.
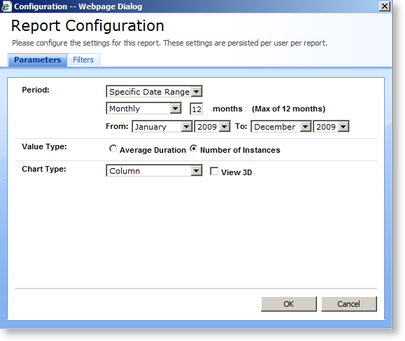
Fig. 1. Process Statistics Report Parameters
 |
Parameter settings are applied per user per report |
| Feature | What it is | How to use it |
|---|---|---|
| Period | Stipulates whether the report should display daily, weekly or monthly information | Click on the down arrow to select the required Period from the drop down list. Alternatively click on the calendar icon next to From and To to select the relevant date if a specific date range is required. |
| Months | Stipulates the number of days, weeks or months' information that should be displayed in the report. Changes according to the Period selected | Type in the number of the total days, weeks or months that needs to be included in the report |
| Value Type | Stipulates which information the report should display, either the average duration of the activity or the number of instances of the activity | Select the relevant check box to display either the average duration of the activity or the number of instances of the activity in the report |
| Chart Type | Configures the display of the report. The user can choose between Area, Bar, Column or Pie Chart. The default type is Column Chart | Click on the down arrow to select the required display of the report. Select the View 3D check box if the report should be displayed in 3D |
See Also
