K2 Web Parts - Editing the Process Graph web part
The Process Graph displays the statistics of a process. This includes the duration that a process has taken to be performed as well as the number of instances of the process.
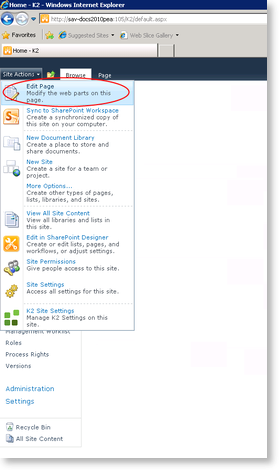
To configure the settings of the Process Graph web part, click Site Actions > Edit Page to open the Process Graph web part.

Click on the arrow next to the web part and select Edit Web Part.

The configuration of the Process Graph web part opens.

The following sections can be configured:
- Settings
- Appearance
- Layout
- Advanced
Visit the following sites to get more information regarding personalization of web parts in SharePoint:
http://msdn.microsoft.com/en-us/library/dd583126(office.11).aspx
http://quickstarts.asp.net/QuickStartv20/aspnet/doc/webparts/edit.aspx
