28. Create an Item View for Reports
In this step, you will create an item view, then add reporting controls to the view. K2 provides a number of reporting controls out-of-the-box which you can find in the designer toolbox. The reporting controls you will add show the number of expense claims submitted over the last 30 days and the average processing time for the claims.
- Begin by adding a new view from the K2 Application elements page. Use the table below to configure the general properties.
Field Value Name Expense Claim Reports Description Contains report controls for expense claims. Category (leave default value unchanged) View Type Item View Data Source (blank) - From the K2 Application elements page, add a new item view to your application and configure it with the following settings:
Field Value Name Expense Claim Reports Description Contains report controls for expense claims. Category (leave default value unchanged) View Type Item View Data Source (blank) 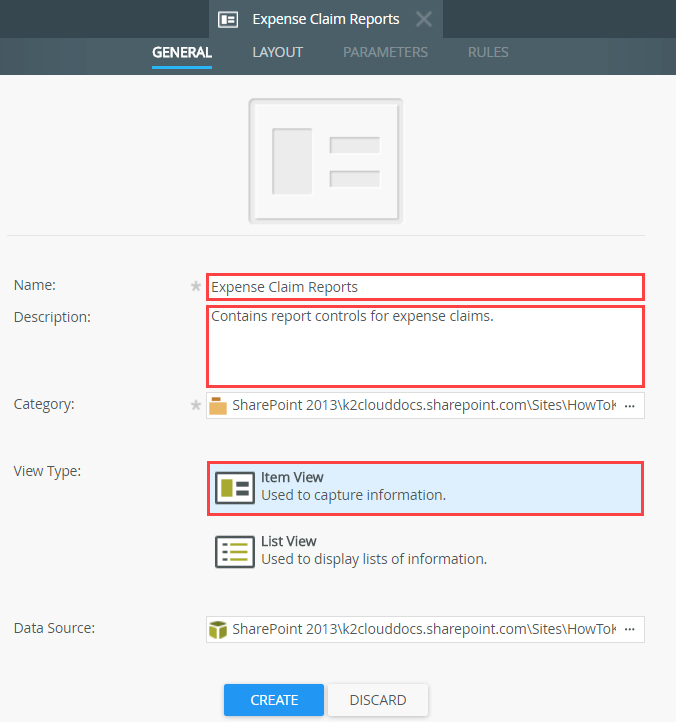
- From the K2 Application elements page, add a new item view to your application and configure it with the following settings:
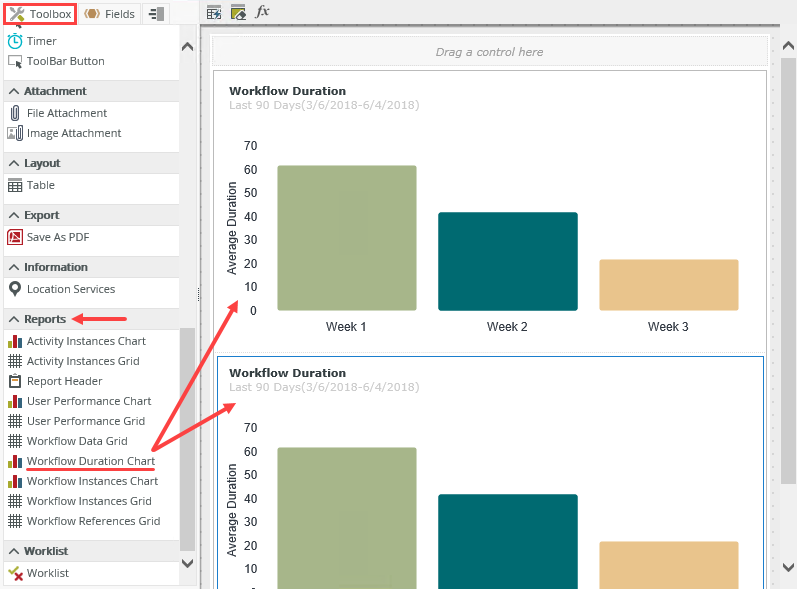
- Add a layout table with one column and two rows, then drop two Workflow Duration Chart controls into each row of the layout table.
- On the layout screen, click the Create Layout Table only link and add a layout table with one column and two rows.
- From the Toolbox, drag a Workflow Duration Chart control into each of the rows of the table.
- Configure the first chart control as follows:
Property Value Name Chart Instances Text Number of claims submitted Workflow Names Use the ellipsis button to select the Expense Claim Workflow. Status (All) Range Last 30 days Group By Weekly Display Value Instance Count - Select the first chart on the view and configure the properties as follows: (Keep the default values for the remaining properties.)
Property Value Notes Name Chart Instances Title Number of claims submitted Workflow Names Use the ellipsis button to select the Expense Claim Workflow You only want to show the Expense Claim Workflow on this report. 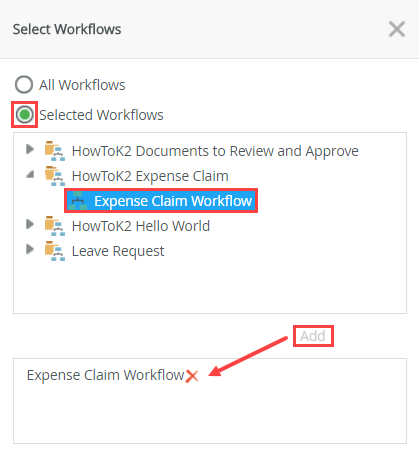
Status (All) Range Last 30 days You only want to show data for the last 30 days. Group By Weekly Display Value Instance Count This will show the number of instances of the workflow that were started. 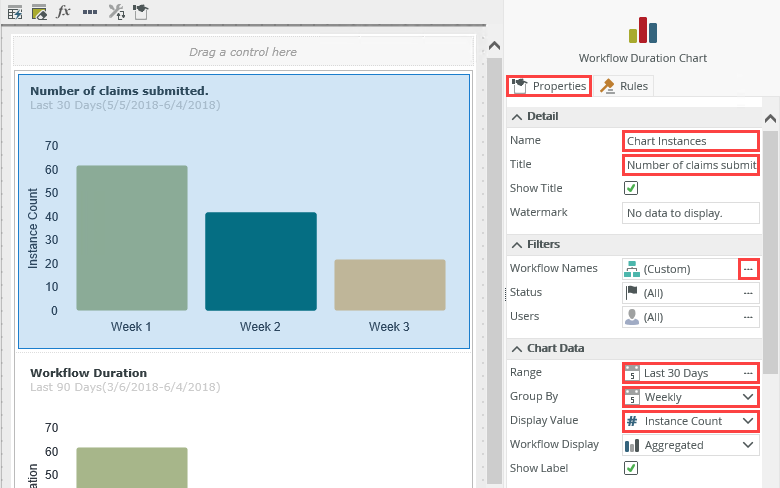
- Select the first chart on the view and configure the properties as follows: (Keep the default values for the remaining properties.)
- Configure the second chart control as follows:
Property Value Name Chart Duration Text Average Duration Workflow Names Use the ellipsis button to select the Expense Claim Workflow. Status (All) Range Last 30 days Group By Weekly Display Value Duration - Select the second chart and configure the properties as follows: (You can leave all other properties on their default values.)
Property Value Notes Name Chart Duration Text Average Duration Workflow Names Use the ellipsis button to select the Expense Claim Workflow You only want to show the Expense Claim Workflow on this report. Status (All) Range Last 30 days You only want to show data for the last 30 days. Group By Weekly Display Value Duration This will show the average duration of workflows.
- Select the second chart and configure the properties as follows: (You can leave all other properties on their default values.)
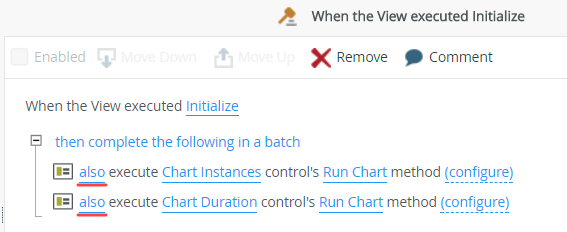
- Modify the when the View executed initialize rule to call the Run Chart method as a batch for each report control.
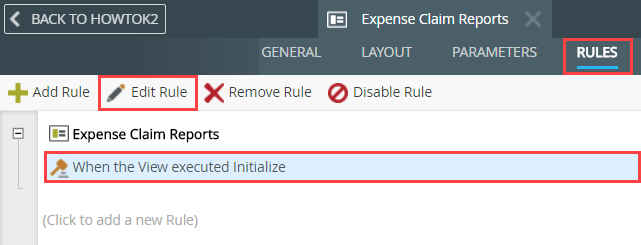
- Navigate to the RULES screen of the view and edit the When the View executed Initialize rule.
- Notice in the rule definition pane, K2 has already added rules for the chart controls. Each chart control is configured for the Run Chart method by default. Configure the rules to run in a batch by clicking the then word and selecting also for both actions. The rule should look like the image below.
- Click OK to close the Rule Designer and FINISH the form designer.
- Navigate to the RULES screen of the view and edit the When the View executed Initialize rule.
Review
In this step, you created an item view that contains two workflow reporting controls. The first control displays the number of workflow instances and the second displays the average duration. K2 provides a number of out-of-the-box reporting controls you can use to create your own custom reporting dashboard. In the next step, you will create a new form, then add both the list and item views.