Manually Debugging Forms
Debugging of Forms needs to be done manually. Follow the steps in order to perform the debugging of Forms:
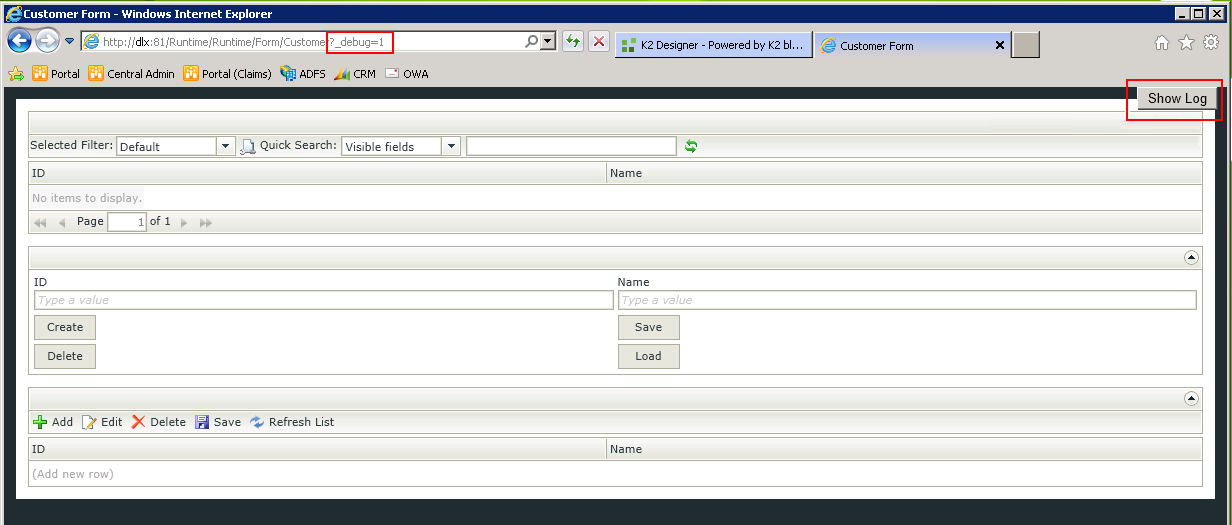
- Add an extra query string parameter to the URL: “?_debug=1”
- The value “1” is the debug level and you can choose a value 1-5 as explained below.
- Eg. http://dlx:81/Runtime/Runtime/Form/ExpenseClaim/?_debug=1
- Choose a level of debugging:
- When setting the debug level to 5, only the error messages will be displayed
- The frequency of logging will decrease as the debug level number increases
- The importance of the message increases as the level increases
Levels:
1 = Debug
2 = Message
3 = Info
4 = Warning
5 = Error
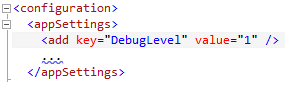
- Alternatively add the setting to the runtime site’s web.config as follows:
This file is normally installed in the following folder: C:\Program Files (x86)\K2 Blackpearl\K2 smartforms Runtime\
- This will add the following to the top right corner of your page (it will only show once a debugging message has been logged as per your chosen debug level)
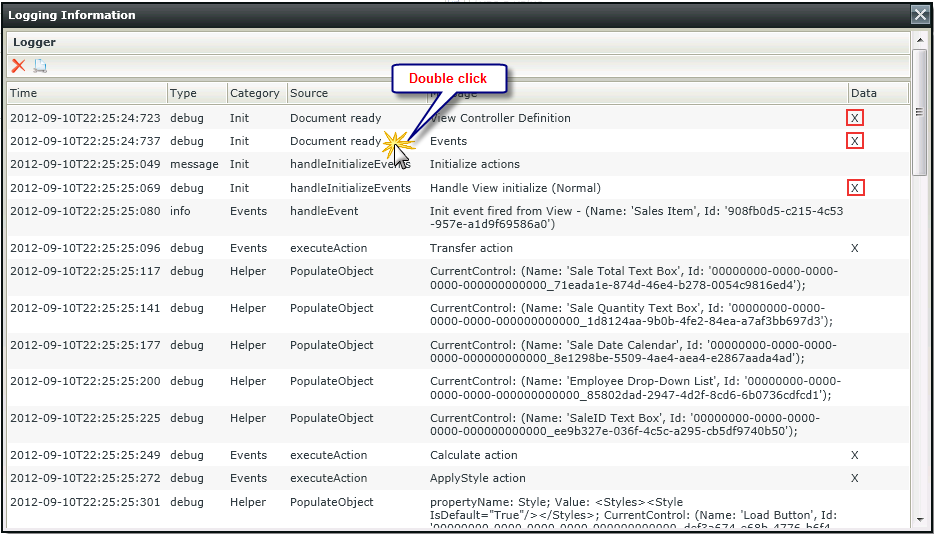
- Clicking on the Show Log button, the logger information will be presented.
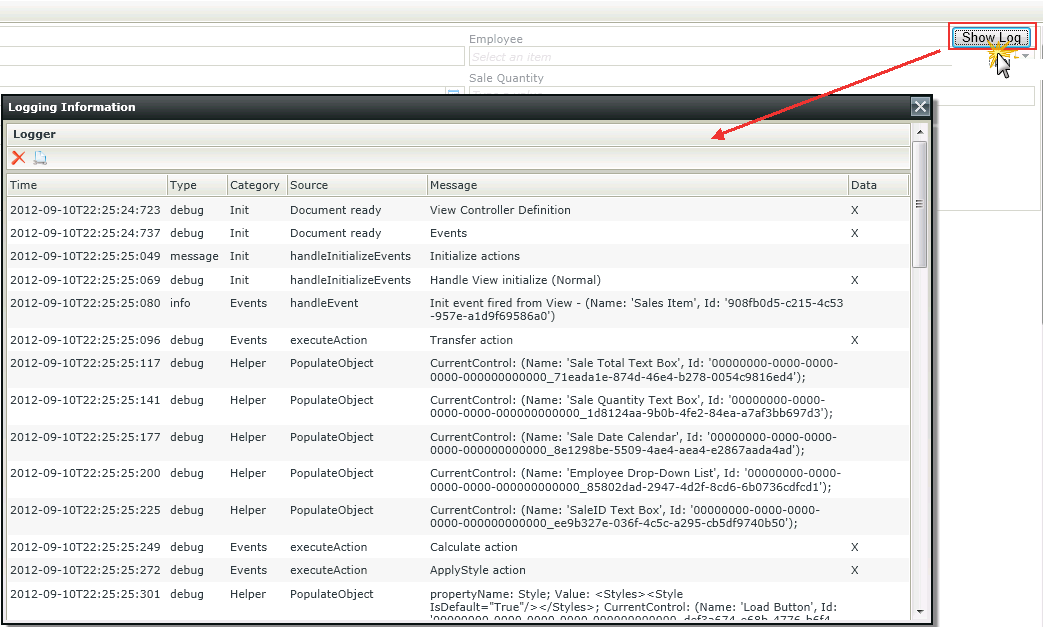
- There are two toolbar buttons:

- The first will clear the log,
- The second will get the complete log XML (please select all of this text and copy into a new text document and attach this to any SmartForms runtime ticket that is created )
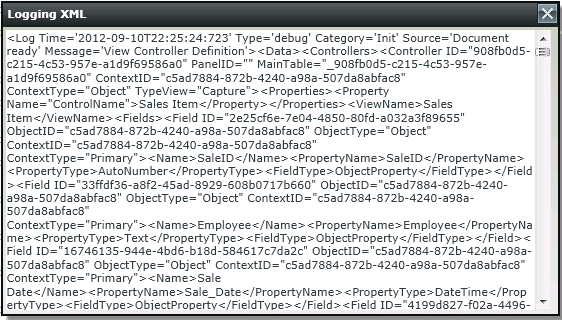
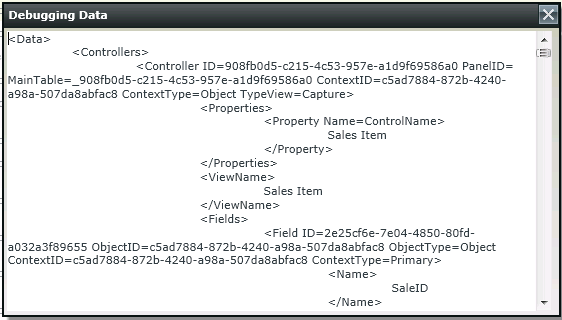
- Certain rows indicate that they contain data. Double clicking any one of these rows with the extra data indication will show a popup window that displays relevant information for the action that was executed
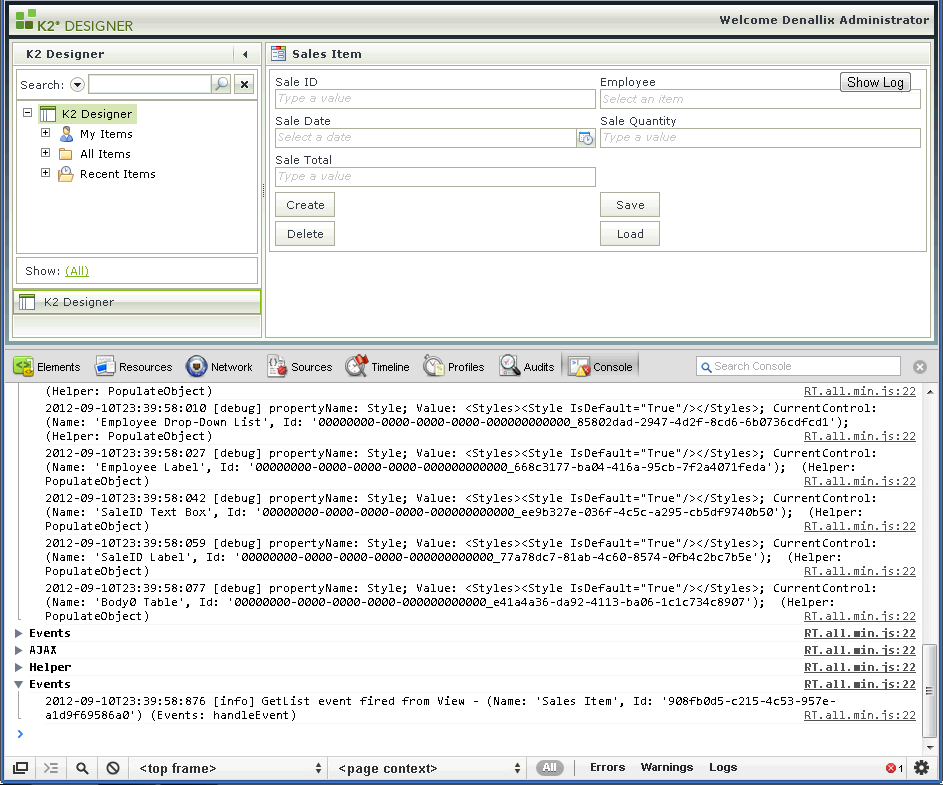
- These messages are logged to the browser’s console as well. There are different steps to get the console in each browser. The console needs to be opened before the event fires on the Form. Following is an example of the Console in Google Chrome.
- Internet Explorer /Chrome
- Press F12
- Click on the console tab
- FireFox
- Download the firebug plugin
- Press F12
- Click on the console tab
- Safari
- Press control and comma (ctrl + ,) at the same time
- Click on the advanced tab
- Check “show develop menu in menu bar”
- Press control alt and c (ctrl + alt + c) at the same time (This will be the only step required for future use)
- Internet Explorer /Chrome
- Clicking on the Data / Document at the end of the line opens up the XML document in some browsers. For custom controls this is useful to find out which function runtime was trying to evaluate by matching the [setfunction] with a property under the control node. You can also get this data in any browser using the next steps below
- If you are using Firefox with Firebug, a highly recommended alternative / extra option is to enable breaking on all errors. There is an option in Firebug to catch all exceptions. To activate or deactivate this option click on the console tab and click the first toolbar button
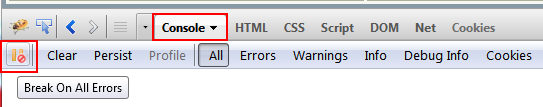
- This allows you to break in the code right where the exception occurs and have a full expandable call stack that when clicked on will take you to the code for the function in the call stack as well
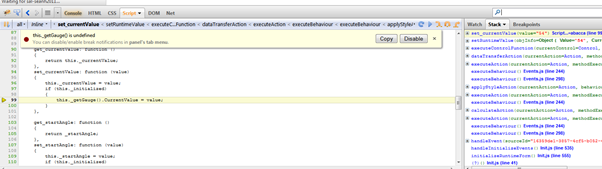
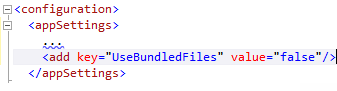
- In order to get the correct stack trace you will need to modify the web.config file. To turn on the minifying performance optimizations temporarily set “UseBundledFiles” to “false”. Refresh the browser and recreate the error scenario. The stack trace will now point to the correct files / line numbers allowing quicker debugging. Remember to change this value back to “true” once you have finished debugging
Debugging can be disabled by editing the runtime config file and commenting out the debug line as shown below:
<!--<add key="DebugLevel" value="1" /> -->
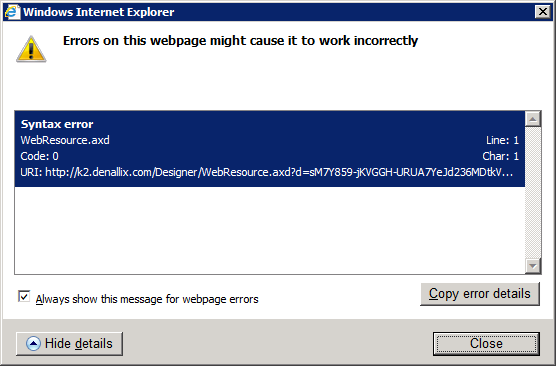
If script debugging is enabled and a syntax error as shown below is displayed relating to WebResource.axd, the following information can be used to determine the cause of the problem.
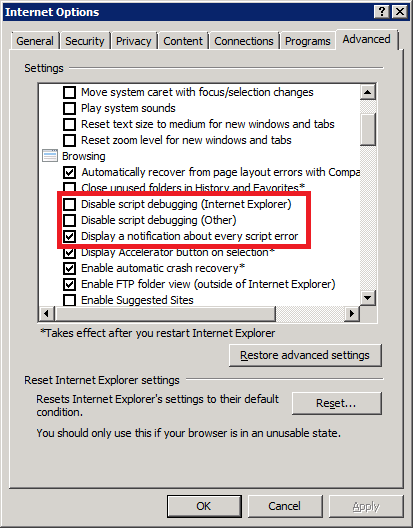
To enable script debugging in Internet Explorer, open Internet Options>Advanced in Internet Explorer and select and deselect the options as shown below
Follow the instructions below to determine the actual file behind the resource name:
- Copy the error details and use Notepad to paste the error to extract the URI
- Copy the URI and paste it into Internet Explorer. It should try to download the resource file throwing the error
- Look at the file contents and see if you can tell what the original file was
- If the file still cannot be determined, then try searching for a utility that can decrypt the data. For an example visit the website http://codeimpossible.com/2009/04/24/Debugging-Syntax-Error-from-a-bad-WebResource-axd-request/
Copy and paste the file in the following directories:
- K2 smartforms Designer directory (C:\Program Files (x86)\K2 blackpearl\K2 smartforms Designer).
- K2 smartforms Runtime directory (C:\Program Files (x86)\K2 blackpearl\K2 smartforms Runtime).
- Browse to that file within the browser (e.g. http://dlx:81/designer/DecryptData.aspx).
- Paste the value of “d=” from the URL in the error into the text box and click the Decrypt button: http://k2.denallix.com/Designer/WebResource.axd?d=sM7Y859-jKVGGH-URUA7YeJd236MDtkV2VMfPoRMXIXuKF8gZHjEGhtPjbFNLDoce4Pzp8LHpsc0VJH81_gBRK2tuIh30D6oqwnZyEC_Mfjjqsx4biuXtG36YpA4tjW36HUCsW1hnMZ2HYobV-RqhggC5yw1&t=634717308054218750
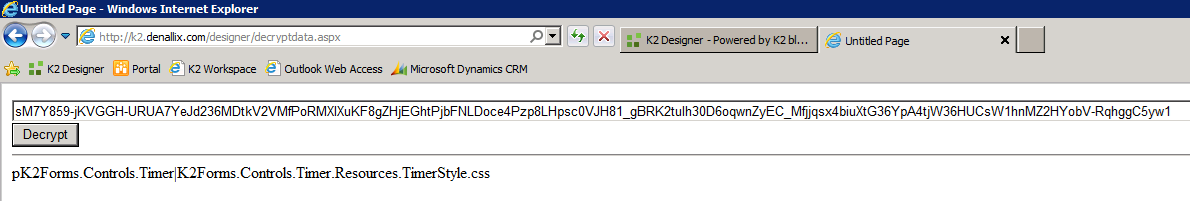
- This will then indicate the control, class and the resource that it is trying to access.
- This information will be useful to include in a support ticket if the issue cannot be resolved